HSBC 2011 Annual Report Download - page 209
Download and view the complete annual report
Please find page 209 of the 2011 HSBC annual report below. You can navigate through the pages in the report by either clicking on the pages listed below, or by using the keyword search tool below to find specific information within the annual report.-
 1
1 -
 2
2 -
 3
3 -
 4
4 -
 5
5 -
 6
6 -
 7
7 -
 8
8 -
 9
9 -
 10
10 -
 11
11 -
 12
12 -
 13
13 -
 14
14 -
 15
15 -
 16
16 -
 17
17 -
 18
18 -
 19
19 -
 20
20 -
 21
21 -
 22
22 -
 23
23 -
 24
24 -
 25
25 -
 26
26 -
 27
27 -
 28
28 -
 29
29 -
 30
30 -
 31
31 -
 32
32 -
 33
33 -
 34
34 -
 35
35 -
 36
36 -
 37
37 -
 38
38 -
 39
39 -
 40
40 -
 41
41 -
 42
42 -
 43
43 -
 44
44 -
 45
45 -
 46
46 -
 47
47 -
 48
48 -
 49
49 -
 50
50 -
 51
51 -
 52
52 -
 53
53 -
 54
54 -
 55
55 -
 56
56 -
 57
57 -
 58
58 -
 59
59 -
 60
60 -
 61
61 -
 62
62 -
 63
63 -
 64
64 -
 65
65 -
 66
66 -
 67
67 -
 68
68 -
 69
69 -
 70
70 -
 71
71 -
 72
72 -
 73
73 -
 74
74 -
 75
75 -
 76
76 -
 77
77 -
 78
78 -
 79
79 -
 80
80 -
 81
81 -
 82
82 -
 83
83 -
 84
84 -
 85
85 -
 86
86 -
 87
87 -
 88
88 -
 89
89 -
 90
90 -
 91
91 -
 92
92 -
 93
93 -
 94
94 -
 95
95 -
 96
96 -
 97
97 -
 98
98 -
 99
99 -
 100
100 -
 101
101 -
 102
102 -
 103
103 -
 104
104 -
 105
105 -
 106
106 -
 107
107 -
 108
108 -
 109
109 -
 110
110 -
 111
111 -
 112
112 -
 113
113 -
 114
114 -
 115
115 -
 116
116 -
 117
117 -
 118
118 -
 119
119 -
 120
120 -
 121
121 -
 122
122 -
 123
123 -
 124
124 -
 125
125 -
 126
126 -
 127
127 -
 128
128 -
 129
129 -
 130
130 -
 131
131 -
 132
132 -
 133
133 -
 134
134 -
 135
135 -
 136
136 -
 137
137 -
 138
138 -
 139
139 -
 140
140 -
 141
141 -
 142
142 -
 143
143 -
 144
144 -
 145
145 -
 146
146 -
 147
147 -
 148
148 -
 149
149 -
 150
150 -
 151
151 -
 152
152 -
 153
153 -
 154
154 -
 155
155 -
 156
156 -
 157
157 -
 158
158 -
 159
159 -
 160
160 -
 161
161 -
 162
162 -
 163
163 -
 164
164 -
 165
165 -
 166
166 -
 167
167 -
 168
168 -
 169
169 -
 170
170 -
 171
171 -
 172
172 -
 173
173 -
 174
174 -
 175
175 -
 176
176 -
 177
177 -
 178
178 -
 179
179 -
 180
180 -
 181
181 -
 182
182 -
 183
183 -
 184
184 -
 185
185 -
 186
186 -
 187
187 -
 188
188 -
 189
189 -
 190
190 -
 191
191 -
 192
192 -
 193
193 -
 194
194 -
 195
195 -
 196
196 -
 197
197 -
 198
198 -
 199
199 -
 200
200 -
 201
201 -
 202
202 -
 203
203 -
 204
204 -
 205
205 -
 206
206 -
 207
207 -
 208
208 -
 209
209 -
 210
210 -
 211
211 -
 212
212 -
 213
213 -
 214
214 -
 215
215 -
 216
216 -
 217
217 -
 218
218 -
 219
219 -
 220
220 -
 221
221 -
 222
222 -
 223
223 -
 224
224 -
 225
225 -
 226
226 -
 227
227 -
 228
228 -
 229
229 -
 230
230 -
 231
231 -
 232
232 -
 233
233 -
 234
234 -
 235
235 -
 236
236 -
 237
237 -
 238
238 -
 239
239 -
 240
240 -
 241
241 -
 242
242 -
 243
243 -
 244
244 -
 245
245 -
 246
246 -
 247
247 -
 248
248 -
 249
249 -
 250
250 -
 251
251 -
 252
252 -
 253
253 -
 254
254 -
 255
255 -
 256
256 -
 257
257 -
 258
258 -
 259
259 -
 260
260 -
 261
261 -
 262
262 -
 263
263 -
 264
264 -
 265
265 -
 266
266 -
 267
267 -
 268
268 -
 269
269 -
 270
270 -
 271
271 -
 272
272 -
 273
273 -
 274
274 -
 275
275 -
 276
276 -
 277
277 -
 278
278 -
 279
279 -
 280
280 -
 281
281 -
 282
282 -
 283
283 -
 284
284 -
 285
285 -
 286
286 -
 287
287 -
 288
288 -
 289
289 -
 290
290 -
 291
291 -
 292
292 -
 293
293 -
 294
294 -
 295
295 -
 296
296 -
 297
297 -
 298
298 -
 299
299 -
 300
300 -
 301
301 -
 302
302 -
 303
303 -
 304
304 -
 305
305 -
 306
306 -
 307
307 -
 308
308 -
 309
309 -
 310
310 -
 311
311 -
 312
312 -
 313
313 -
 314
314 -
 315
315 -
 316
316 -
 317
317 -
 318
318 -
 319
319 -
 320
320 -
 321
321 -
 322
322 -
 323
323 -
 324
324 -
 325
325 -
 326
326 -
 327
327 -
 328
328 -
 329
329 -
 330
330 -
 331
331 -
 332
332 -
 333
333 -
 334
334 -
 335
335 -
 336
336 -
 337
337 -
 338
338 -
 339
339 -
 340
340 -
 341
341 -
 342
342 -
 343
343 -
 344
344 -
 345
345 -
 346
346 -
 347
347 -
 348
348 -
 349
349 -
 350
350 -
 351
351 -
 352
352 -
 353
353 -
 354
354 -
 355
355 -
 356
356 -
 357
357 -
 358
358 -
 359
359 -
 360
360 -
 361
361 -
 362
362 -
 363
363 -
 364
364 -
 365
365 -
 366
366 -
 367
367 -
 368
368 -
 369
369 -
 370
370 -
 371
371 -
 372
372 -
 373
373 -
 374
374 -
 375
375 -
 376
376 -
 377
377 -
 378
378 -
 379
379 -
 380
380 -
 381
381 -
 382
382 -
 383
383 -
 384
384 -
 385
385 -
 386
386 -
 387
387 -
 388
388 -
 389
389 -
 390
390 -
 391
391 -
 392
392 -
 393
393 -
 394
394 -
 395
395 -
 396
396 -
 397
397 -
 398
398 -
 399
399 -
 400
400 -
 401
401 -
 402
402 -
 403
403 -
 404
404 -
 405
405 -
 406
406 -
 407
407 -
 408
408 -
 409
409 -
 410
410 -
 411
411 -
 412
412 -
 413
413 -
 414
414 -
 415
415 -
 416
416 -
 417
417 -
 418
418 -
 419
419 -
 420
420 -
 421
421 -
 422
422 -
 423
423 -
 424
424 -
 425
425 -
 426
426 -
 427
427 -
 428
428 -
 429
429 -
 430
430 -
 431
431 -
 432
432 -
 433
433 -
 434
434 -
 435
435 -
 436
436 -
 437
437 -
 438
438 -
 439
439 -
 440
440
 |
 |

207
Overview Operating & Financial Review Corporate Governance Financial Statements Shareholder Information
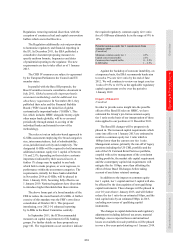
How market risk is managed
All our insurance manufacturing subsidiaries have market risk mandates which specify the investment instruments in
which they are permitted to invest and the maximum quantum of market risk which they may retain. They manage
market risk by using some or all of the techniques listed below, depending on the nature of the contracts they write.
Techniques for managing market risk
• for products with DPF, adjusting bonus rates to manage the liabilities to policyholders. The effect is that a significant portion of the
market risk is borne by the policyholder;
• as far as possible, matching assets to liability cash flows;
• using derivatives, to a limited extent, to protect against adverse market movements or better match liability cash flows;
• for new products with investment guarantees, considering the cost when determining the level of premiums or the price structure;
• periodically reviewing products identified as higher risk, which contain investment guarantees and embedded optionality features linked
to savings and investment products;
• including features designed to mitigate market risk in new products, such as charging surrender penalties to recoup losses incurred when
policyholders surrender their policies;
• exiting, to the extent possible, investment portfolios whose risk is considered unacceptable; and
• repricing of premiums charged to policyholders.
In the product approval process, the risks embedded in new products are identified and assessed. When, for example,
options and guarantees are embedded in new products, the due diligence process ensures that complete and
appropriate risk management procedures are in place. For all but the simplest of guaranteed benefits the assessment is
undertaken by Group Insurance Head Office. Management reviews certain exposures more frequently when markets
are more volatile to ensure that any matters arising are dealt with in a timely fashion.
How the exposure to market risk is measured
Our insurance manufacturing subsidiaries monitor exposures against mandated limits regularly and report them to
Group Insurance Head Office. Exposures are aggregated and reported on a quarterly basis to senior risk management
forums in the Group, including the Group Insurance Market and Liquidity Risk Committee, Group Insurance Risk
Committee and the Group Stress Test Review Group.
Standard measures for quantifying market risks
• for interest rate risk, the sensitivities of the net present values of asset and expected liability cash flows, in total and by currency, to a one
basis point parallel shift in the discount curves used to calculate the net present values;
• for equity price risk, the total market value of equity holdings and the market value of equity holdings by region and country; and
• for foreign exchange risk, the total net short foreign exchange position and the net foreign exchange positions by currency.
The standard measures are relatively straightforward to calculate and aggregate, but they have limitations. The most
significant one is that a parallel shift in yield curves of one basis point does not capture the non-linear relationships
between the values of certain assets and liabilities and interest rates. Non-linearity arises, for example, from
investment guarantees and product features which enable policyholders to surrender their policies. We bear the
shortfall if the yields on investments held to support contracts with guaranteed benefits are less than the investment
returns implied by the guaranteed benefits.
We recognise these limitations and augment our standard measures with stress tests which examine the effect of a
range of market rate scenarios on the aggregate annual profits and total equity of our insurance manufacturing
subsidiaries, after taking into consideration tax and accounting treatments where material and relevant. The results
of these tests are reported to Group Insurance Head Office and risk committees every quarter.
Credit risk
(Audited)
Description of credit risk
We used to sell certain unit-linked life insurance contracts which were reinsured with a third-party counterparty, who
also underwrote market return guarantees. We are exposed to credit risk to the extent that the counterparty is unable
to meet the terms of the guaranteed benefits. The cost to us of market return guarantees increases when interest rates
fall, equity markets fall or market volatility increases. In addition, when determined by reference to a discounted cash
