HSBC 2011 Annual Report Download - page 260
Download and view the complete annual report
Please find page 260 of the 2011 HSBC annual report below. You can navigate through the pages in the report by either clicking on the pages listed below, or by using the keyword search tool below to find specific information within the annual report.-
 1
1 -
2
-
3
-
4
-
5
-
6
-
7
-
8
-
9
-
10
-
11
-
12
-
13
-
14
-
15
-
16
-
17
-
18
-
19
-
20
-
21
-
22
-
23
-
24
-
25
-
26
-
27
-
28
-
29
-
30
-
31
-
32
-
33
-
34
-
35
-
36
-
37
-
38
-
39
-
40
-
41
-
42
-
43
-
44
-
45
-
46
-
47
-
48
-
49
-
50
-
51
-
52
-
53
-
54
-
55
-
56
-
57
-
58
-
59
-
60
-
61
-
62
-
63
-
64
-
65
-
66
-
67
-
68
-
69
-
70
-
71
-
72
-
73
-
74
-
75
-
76
-
77
-
78
-
79
-
80
-
81
-
82
-
83
-
84
-
85
-
86
-
87
-
88
-
89
-
90
-
91
-
92
-
93
-
94
-
95
-
96
-
97
-
98
-
99
-
100
-
101
-
102
-
103
-
104
-
105
-
106
-
107
-
108
-
109
-
110
-
111
-
112
-
113
-
114
-
115
-
116
-
117
-
118
-
119
-
120
-
121
-
122
-
123
-
124
-
125
-
126
-
127
-
128
-
129
-
130
-
131
-
132
-
133
-
134
-
135
-
136
-
137
-
138
-
139
-
140
-
141
-
142
-
143
-
144
-
145
-
146
-
147
-
148
-
149
-
150
-
151
-
152
-
153
-
154
-
155
-
156
-
157
-
158
-
159
-
160
-
161
-
162
-
163
-
164
-
165
-
166
-
167
-
168
-
169
-
170
-
171
-
172
-
173
-
174
-
175
-
176
-
177
-
178
-
179
-
180
-
181
-
182
-
183
-
184
-
185
-
186
-
187
-
188
-
189
-
190
-
191
-
192
-
193
-
194
-
195
-
196
-
197
-
198
-
199
-
200
-
201
-
202
-
203
-
204
-
205
-
206
-
207
-
208
-
209
-
210
-
211
-
212
-
213
-
214
-
215
-
216
-
217
-
218
-
219
-
220
-
221
-
222
-
223
-
224
-
225
-
226
-
227
-
228
-
229
-
230
-
231
-
232
-
233
-
234
-
235
-
236
-
237
-
238
-
239
-
240
-
241
-
242
-
243
-
244
-
245
-
246
-
247
-
248
-
249
-
 250
250 -
 251
251 -
 252
252 -
 253
253 -
 254
254 -
 255
255 -
 256
256 -
 257
257 -
 258
258 -
 259
259 -
 260
260 -
 261
261 -
 262
262 -
 263
263 -
 264
264 -
 265
265 -
 266
266 -
 267
267 -
 268
268 -
 269
269 -
 270
270 -
271
-
272
-
273
-
274
-
275
-
276
-
277
-
278
-
279
-
280
-
281
-
282
-
283
-
284
-
285
-
286
-
287
-
288
-
289
-
290
-
291
-
292
-
293
-
294
-
295
-
296
-
297
-
298
-
299
-
300
-
301
-
302
-
303
-
304
-
305
-
306
-
307
-
308
-
309
-
310
-
311
-
312
-
313
-
314
-
315
-
316
-
317
-
318
-
319
-
320
-
321
-
322
-
323
-
324
-
325
-
326
-
327
-
328
-
329
-
330
-
331
-
332
-
333
-
334
-
335
-
336
-
337
-
338
-
339
-
340
-
341
-
342
-
343
-
344
-
345
-
346
-
347
-
348
-
349
-
350
-
351
-
352
-
353
-
354
-
355
-
356
-
357
-
358
-
359
-
360
-
361
-
362
-
363
-
364
-
365
-
366
-
367
-
368
-
369
-
370
-
371
-
372
-
373
-
374
-
375
-
376
-
377
-
378
-
379
-
380
-
381
-
382
-
383
-
384
-
385
-
386
-
387
-
388
-
389
-
390
-
391
-
392
-
393
-
394
-
395
-
396
-
397
-
398
-
399
-
400
-
401
-
402
-
403
-
404
-
405
-
406
-
407
-
408
-
409
-
410
-
411
-
412
-
413
-
414
-
415
-
416
-
417
-
418
-
419
-
420
-
421
-
422
-
423
-
424
-
425
-
426
-
427
-
428
-
429
-
430
-
431
-
432
-
433
-
434
-
435
-
436
-
437
-
438
-
439
-
440
 |
 |

HSBC HOLDINGS PLC
Directors’ Remuneration Report (continued)
Group variable pay pool // Regulation / Executive Directors’ remuneration > Composition
258
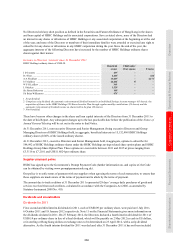
• notwithstanding the savings noted above, the
cost efficiency ratio (‘CER’) increased from
55.2% in 2010 to 57.5% in 2011. This largely
reflected an increase in significant items
including restructuring costs, customer redress
programmes and the bank levy introduced by
the UK government. The increase also reflected
a rise in staff costs due to wage inflation, most
notably in faster-growing markets, and higher
average staff numbers. The Group remains
focused on achieving the CER target range of
48-52%;
• we maintained a strong balance sheet, with a
ratio of customer advances to customer accounts
of 75%. On an underlying basis, we grew loans
to customers and customer deposits across our
target markets of Latin America, Hong Kong,
Rest of Asia-Pacific and Middle East and North
Africa;
• we increased dividends in respect of 2011 to our
shareholders from US$0.36 per ordinary share
in 2010 to US$0.41 per ordinary share in respect
of 2011; and
• our core tier 1 ratio remained strong in the
face of a difficult operating and ever-changing
regulatory environment.
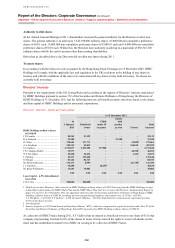
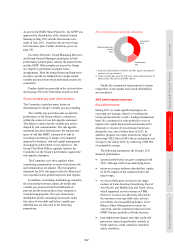
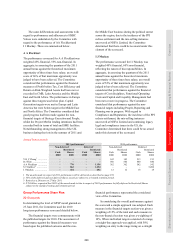
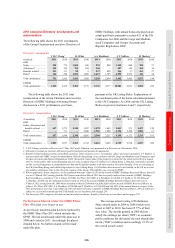
The 2011 Group variable pay pool that was
approved by the Committee is detailed below. It
is stated in US dollars in line with the main currency
of presentation of our results and on a constant
currency basis.
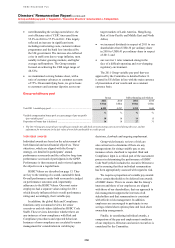
Group variable pay pool
Group Global Banking and Markets
2011 2010 2011 2010
US$m US$m US$m US$m
Total 2011 variable pay pool .................................................................... 4,223 4,297 1,210 1,640
% % % %
Variable compensation bonus pool as a percentage of pre-tax profit
(pre-variable pay)1 ................................................................................ 18 18 14 15
Proportion of bonus that is deferred ......................................................... 16 18 27 31
1 The 2011 Group pre-tax profit pre-variable pay includes the add-back of restructuring costs incurred during the year, and the
adjustment for movements in the fair value of own debt attributable to credit spread.
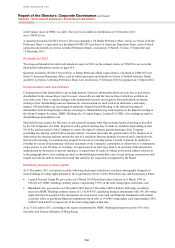
Individual awards
Individual awards are based on the achievement of
both financial and non-financial objectives. These
objectives, which are aligned with the Group’s
strategy, are detailed in participants’ annual
performance scorecards and the collective long-term
performance scorecard of participants in the GPSP.
Performance is then measured and reviewed against
the objectives on a regular basis.
HSBC Values are described on page 13. They
are key to the running of a sound, sustainable bank.
Overall performance under both scorecards is judged
on performance outcomes and, importantly,
adherence to the HSBC Values. Our most senior
employees had a separate values rating for 2011
which directly influenced their overall performance
rating and, accordingly, their variable pay.
In addition, the global Risk and Compliance
functions carry out annual reviews for senior
executives and risk-takers (defined as HSBC Code
Staff). These reviews determine whether there are
any instances of non-compliance with Risk and
Compliance procedures and expected behaviour.
Instances of non-compliance are escalated to senior
management for consideration in variable pay
decisions, clawback and ongoing employment.
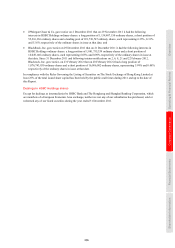
Group-wide thematic reviews of risk are
also carried out to determine if there are any
transgressions for sizing variable pay or any
instances where clawback is required. Risk and
Compliance input is a critical part of the assessment
process in determining the performance of HSBC
Code Staff (which includes the executive Directors)
and in ensuring that their individual remuneration
has been appropriately assessed with regard to risk.
We require a proportion of variable pay awards
above certain thresholds to be deferred into awards
of HSBC shares. This is to ensure that the Group’s
interests and those of our employees are aligned
with those of our shareholders, that our approach to
risk management supports the interests of all
stakeholders and that remuneration is consistent
with effective risk management. In addition,
employees are encouraged to participate in our
savings-related share options plans and local share
ownership arrangements.
Finally, in considering individual awards, a
comparison of the pay and employment conditions
of our employees, Directors and senior executives is
considered by the Committee.