HSBC 2011 Annual Report Download - page 321
Download and view the complete annual report
Please find page 321 of the 2011 HSBC annual report below. You can navigate through the pages in the report by either clicking on the pages listed below, or by using the keyword search tool below to find specific information within the annual report.-
 1
1 -
2
-
3
-
4
-
5
-
6
-
7
-
8
-
9
-
10
-
11
-
12
-
13
-
14
-
15
-
16
-
17
-
18
-
19
-
20
-
21
-
22
-
23
-
24
-
25
-
26
-
27
-
28
-
29
-
30
-
31
-
32
-
33
-
34
-
35
-
36
-
37
-
38
-
39
-
40
-
41
-
42
-
43
-
44
-
45
-
46
-
47
-
48
-
49
-
50
-
51
-
52
-
53
-
54
-
55
-
56
-
57
-
58
-
59
-
60
-
61
-
62
-
63
-
64
-
65
-
66
-
67
-
68
-
69
-
70
-
71
-
72
-
73
-
74
-
75
-
76
-
77
-
78
-
79
-
80
-
81
-
82
-
83
-
84
-
85
-
86
-
87
-
88
-
89
-
90
-
91
-
92
-
93
-
94
-
95
-
96
-
97
-
98
-
99
-
100
-
101
-
102
-
103
-
104
-
105
-
106
-
107
-
108
-
109
-
110
-
111
-
112
-
113
-
114
-
115
-
116
-
117
-
118
-
119
-
120
-
121
-
122
-
123
-
124
-
125
-
126
-
127
-
128
-
129
-
130
-
131
-
132
-
133
-
134
-
135
-
136
-
137
-
138
-
139
-
140
-
141
-
142
-
143
-
144
-
145
-
146
-
147
-
148
-
149
-
150
-
151
-
152
-
153
-
154
-
155
-
156
-
157
-
158
-
159
-
160
-
161
-
162
-
163
-
164
-
165
-
166
-
167
-
168
-
169
-
170
-
171
-
172
-
173
-
174
-
175
-
176
-
177
-
178
-
179
-
180
-
181
-
182
-
183
-
184
-
185
-
186
-
187
-
188
-
189
-
190
-
191
-
192
-
193
-
194
-
195
-
196
-
197
-
198
-
199
-
200
-
201
-
202
-
203
-
204
-
205
-
206
-
207
-
208
-
209
-
210
-
211
-
212
-
213
-
214
-
215
-
216
-
217
-
218
-
219
-
220
-
221
-
222
-
223
-
224
-
225
-
226
-
227
-
228
-
229
-
230
-
231
-
232
-
233
-
234
-
235
-
236
-
237
-
238
-
239
-
240
-
241
-
242
-
243
-
244
-
245
-
246
-
247
-
248
-
249
-
250
-
251
-
252
-
253
-
254
-
255
-
256
-
257
-
258
-
259
-
260
-
261
-
262
-
263
-
264
-
265
-
266
-
267
-
268
-
269
-
270
-
271
-
272
-
273
-
274
-
275
-
276
-
277
-
278
-
279
-
280
-
281
-
282
-
283
-
284
-
285
-
286
-
287
-
288
-
289
-
290
-
291
-
292
-
293
-
294
-
295
-
296
-
297
-
298
-
299
-
300
-
301
-
302
-
303
-
304
-
305
-
306
-
307
-
308
-
309
-
310
-
 311
311 -
 312
312 -
 313
313 -
 314
314 -
 315
315 -
 316
316 -
 317
317 -
 318
318 -
 319
319 -
 320
320 -
 321
321 -
 322
322 -
 323
323 -
 324
324 -
 325
325 -
 326
326 -
 327
327 -
 328
328 -
 329
329 -
 330
330 -
 331
331 -
332
-
333
-
334
-
335
-
336
-
337
-
338
-
339
-
340
-
341
-
342
-
343
-
344
-
345
-
346
-
347
-
348
-
349
-
350
-
351
-
352
-
353
-
354
-
355
-
356
-
357
-
358
-
359
-
360
-
361
-
362
-
363
-
364
-
365
-
366
-
367
-
368
-
369
-
370
-
371
-
372
-
373
-
374
-
375
-
376
-
377
-
378
-
379
-
380
-
381
-
382
-
383
-
384
-
385
-
386
-
387
-
388
-
389
-
390
-
391
-
392
-
393
-
394
-
395
-
396
-
397
-
398
-
399
-
400
-
401
-
402
-
403
-
404
-
405
-
406
-
407
-
408
-
409
-
410
-
411
-
412
-
413
-
414
-
415
-
416
-
417
-
418
-
419
-
420
-
421
-
422
-
423
-
424
-
425
-
426
-
427
-
428
-
429
-
430
-
431
-
432
-
433
-
434
-
435
-
436
-
437
-
438
-
439
-
440
 |
 |

319
Overview Operating & Financial Review Corporate Governance Financial Statements Shareholder Information
needed to meet the liabilities if the Scheme was discontinued and the members’ benefits bought out with an insurance
company (although in practice this may not be possible for a plan of this size) or the Trustee continued to run the plan
without the support of HSBC. The amount required under this approach is estimated to be £19.8bn (US$28.9bn) as at
31 December 2008. In arriving at this estimation, a more prudent assumption about future mortality was made than
for the assessment of the ongoing position and it was assumed that the Trustee would alter the investment strategy to
be an appropriately matched portfolio of UK government bonds. An explicit allowance for expenses was also
included.
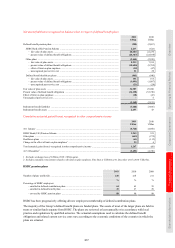
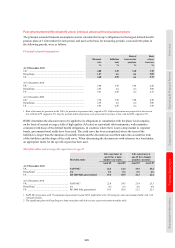
In February 2010, HSBC Bank plc agreed with the Trustee of the Scheme to reduce the deficit of the plan by meeting
a schedule of future funding payments. On 17 June 2010, HSBC Bank plc agreed with the Trustee to accelerate the
reduction of the deficit of the plan with a special contribution of £1,760m (US$2,638m) in 2010 followed by a
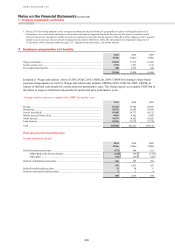
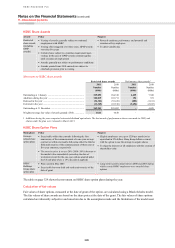
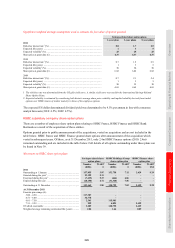
revised payment schedule in the following years, as shown below:
Additional future funding payments to the principal plan
Original plan Original plan Revised plan Revised plan
US$m1 £m US$m1 £m
2012 ............................................................. 720 465 – –
2013 ............................................................. 720 465 – –
2014 ............................................................. 720 465 – –
2015 ............................................................. 975 630 – –
2016 ............................................................. 975 630 766 495
2017 ............................................................. 975 630 975 630
2018 ............................................................. 975 630 975 630
1 The payment schedule was agreed with the Trustee in pounds sterling and the equivalent US dollar amounts are shown at the exchange
rate effective as at 31 December 2011.
In December 2011, HSBC Bank plc made a £184m (US$286m) special contribution to the Scheme. The additional
contribution did not result in an amendment to the future funding payments to the principal plan, set out in the table
above.
HSBC considers that the contributions set out above, together with investment returns at an expected level of
240 basis points above the LIBOR swap curve, would be sufficient to meet the deficit as at 31 December 2008 over
the agreed period. At each subsequent actuarial valuation, HSBC has agreed with the Trustee that any shortfall in
investment returns relative to this expected level, subject to a maximum of 50 basis points per annum, will be
eliminated by payment of equal cash instalments over the remaining years to the end of this recovery plan period.
HSBC Bank plc also agreed to make ongoing contributions to the principal plan in respect of the accrual of benefits
of defined benefit section members at the rate of 34% of pensionable salaries (less member contributions) payable
from 1 April 2010 until the completion of the next actuarial valuation, due as at 31 December 2011. During 2009,
HSBC paid contributions at the rate of 38% of pensionable salaries (less member contributions) and continued
contributions at this rate until 31 March 2010.
On 1 July 2009, changes to the design of the principal plan were made. This included the introduction of employee
contributions, optionality concerning future benefit accrual and, with effect from 1 April 2010, an increased normal
retirement age of 65 years. In addition, enhancements to the defined contribution section were also introduced.
Pension plans in Hong Kong
In Hong Kong, the HSBC Group Hong Kong Local Staff Retirement Benefit Scheme covers employees of The
Hongkong and Shanghai Banking Corporation and certain other employees of HSBC. The scheme comprises a
funded defined benefit scheme (which provides a lump sum on retirement but is now closed to new members) and a
defined contribution scheme. The latter was established on 1 January 1999 for new employees. The latest actuarial
valuation of the defined benefit scheme was made at 31 December 2010 by Wing Lui, Fellow of the Society of
Actuaries, of Towers Watson Hong Kong Limited. At that valuation date, the market value of the defined benefit
scheme’s assets was US$1,109m. On an ongoing basis, the actuarial value of the defined benefit scheme’s assets
represented 104% of the actuarial present value of the benefits accrued to members, after allowing for expected future
increases in salaries, and the resulting surplus amounted to US$41m. On a wind-up basis, the defined benefit scheme’s
assets represented 110% of the members’ vested benefits, based on current salaries, and the resulting surplus amounted to
US$105m. The attained age method has been adopted for the valuation and the major assumptions used in this
valuation were a discount rate of 6% per annum and long-term salary increases of 5% per annum.