HSBC 2011 Annual Report Download - page 16
Download and view the complete annual report
Please find page 16 of the 2011 HSBC annual report below. You can navigate through the pages in the report by either clicking on the pages listed below, or by using the keyword search tool below to find specific information within the annual report.-
 1
1 -
2
-
3
-
4
-
5
-
 6
6 -
 7
7 -
 8
8 -
 9
9 -
 10
10 -
 11
11 -
 12
12 -
 13
13 -
 14
14 -
 15
15 -
 16
16 -
 17
17 -
 18
18 -
 19
19 -
 20
20 -
 21
21 -
 22
22 -
 23
23 -
 24
24 -
 25
25 -
 26
26 -
27
-
28
-
29
-
30
-
31
-
32
-
33
-
34
-
35
-
36
-
37
-
38
-
39
-
40
-
41
-
42
-
43
-
44
-
45
-
46
-
47
-
48
-
49
-
50
-
51
-
52
-
53
-
54
-
55
-
56
-
57
-
58
-
59
-
60
-
61
-
62
-
63
-
64
-
65
-
66
-
67
-
68
-
69
-
70
-
71
-
72
-
73
-
74
-
75
-
76
-
77
-
78
-
79
-
80
-
81
-
82
-
83
-
84
-
85
-
86
-
87
-
88
-
89
-
90
-
91
-
92
-
93
-
94
-
95
-
96
-
97
-
98
-
99
-
100
-
101
-
102
-
103
-
104
-
105
-
106
-
107
-
108
-
109
-
110
-
111
-
112
-
113
-
114
-
115
-
116
-
117
-
118
-
119
-
120
-
121
-
122
-
123
-
124
-
125
-
126
-
127
-
128
-
129
-
130
-
131
-
132
-
133
-
134
-
135
-
136
-
137
-
138
-
139
-
140
-
141
-
142
-
143
-
144
-
145
-
146
-
147
-
148
-
149
-
150
-
151
-
152
-
153
-
154
-
155
-
156
-
157
-
158
-
159
-
160
-
161
-
162
-
163
-
164
-
165
-
166
-
167
-
168
-
169
-
170
-
171
-
172
-
173
-
174
-
175
-
176
-
177
-
178
-
179
-
180
-
181
-
182
-
183
-
184
-
185
-
186
-
187
-
188
-
189
-
190
-
191
-
192
-
193
-
194
-
195
-
196
-
197
-
198
-
199
-
200
-
201
-
202
-
203
-
204
-
205
-
206
-
207
-
208
-
209
-
210
-
211
-
212
-
213
-
214
-
215
-
216
-
217
-
218
-
219
-
220
-
221
-
222
-
223
-
224
-
225
-
226
-
227
-
228
-
229
-
230
-
231
-
232
-
233
-
234
-
235
-
236
-
237
-
238
-
239
-
240
-
241
-
242
-
243
-
244
-
245
-
246
-
247
-
248
-
249
-
250
-
251
-
252
-
253
-
254
-
255
-
256
-
257
-
258
-
259
-
260
-
261
-
262
-
263
-
264
-
265
-
266
-
267
-
268
-
269
-
270
-
271
-
272
-
273
-
274
-
275
-
276
-
277
-
278
-
279
-
280
-
281
-
282
-
283
-
284
-
285
-
286
-
287
-
288
-
289
-
290
-
291
-
292
-
293
-
294
-
295
-
296
-
297
-
298
-
299
-
300
-
301
-
302
-
303
-
304
-
305
-
306
-
307
-
308
-
309
-
310
-
311
-
312
-
313
-
314
-
315
-
316
-
317
-
318
-
319
-
320
-
321
-
322
-
323
-
324
-
325
-
326
-
327
-
328
-
329
-
330
-
331
-
332
-
333
-
334
-
335
-
336
-
337
-
338
-
339
-
340
-
341
-
342
-
343
-
344
-
345
-
346
-
347
-
348
-
349
-
350
-
351
-
352
-
353
-
354
-
355
-
356
-
357
-
358
-
359
-
360
-
361
-
362
-
363
-
364
-
365
-
366
-
367
-
368
-
369
-
370
-
371
-
372
-
373
-
374
-
375
-
376
-
377
-
378
-
379
-
380
-
381
-
382
-
383
-
384
-
385
-
386
-
387
-
388
-
389
-
390
-
391
-
392
-
393
-
394
-
395
-
396
-
397
-
398
-
399
-
400
-
401
-
402
-
403
-
404
-
405
-
406
-
407
-
408
-
409
-
410
-
411
-
412
-
413
-
414
-
415
-
416
-
417
-
418
-
419
-
420
-
421
-
422
-
423
-
424
-
425
-
426
-
427
-
428
-
429
-
430
-
431
-
432
-
433
-
434
-
435
-
436
-
437
-
438
-
439
-
440
 |
 |

HSBC HOLDINGS PLC
Report of the Directors: Overview (continued)
KPIs
14
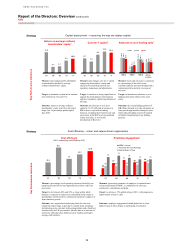
Strategy Capital deployment – improving the way we deploy capital
Return on average ordinary
shareholders’ equity3 Core tier 1 capital8 Advances to core funding ratio9
15.9
4.7 5.1
9.5
10.9
'07 '08 '09 '10 '11
8.1
7.0
9.4
10.5 10.1
'07 '08 '09 '10 '11
101.0
70.3
89.1
99.8
75.0
85.7
86.4
105.0
55.5
85.9
103.0
98.3
HBEU HBAP HBUS Other
entities
2009 2010 2011
HBEU HBAP HBUS Other
entities
Measure: (percentage) profit attributable
to shareholders divided by average
ordinary shareholders’ equity.
Measure: (percentage) core tier 1 capital
comprising shareholders’ equity and
related non-controlling interests less
regulatory deductions and adjustments.
Measure: loans and advances to customers
as a percentage of the total of core
customer deposits and term funding with a
remaining term to maturity in excess of
one year.
Target: to maintain a return in the mediu
m
term of between 12% and 15%.
Target: to maintain a strong capital base t
o
support the development of the business
and meet regulatory capital requirements at
all times.
Target: to maintain an advances to core
funding ratio below limits set for each
entity.
Key Performance Indicators
Outcome: return on average ordinary
shareholders’ equity was below the target
range, but 1.4 percentage points higher
than 2010.
Outcome: the decrease in core tier 1
capital to 10.1% reflected an increase in
RWAs due to a growth in lending
balances, including those held for sale and
an increase in the RWAs of our mainland
China associates, as well as the
introduction of Basel 2.5.
Outcome: the strong funding position of
HBAP has allowed us to take advantage of
loan growth opportunities during the year,
while reduced lending in the US resulted
in further strengthening of our funding
position.
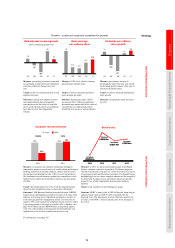
Strategy Cost efficiency – a lean and values-driven organisation
Cost efficiency
(2011: underlying cost efficiency 61%)
Employee engagement
49.4
60.1
52
55.2
57.5
'07 '08 '09 '10 '11
60
67
71
63 63 64 65 67
75 77
74 72 72
68 69
'07 '08 '09 '10 '11
HSBC – Actual
Financial Services Average
Global Best in Class
Measure: (percentage) total operating expenses divided by net
operating income before loan impairment and other credit risk
provisions.
Measure: (percentage) measure of employee’s emotional and
rational attachment to HSBC, a combination of advocacy,
satisfaction, commitment and pride.
Target: to be between 48% and 52%, a range within which
business is expected to remain to accommodate both returns to
shareholders and the need for continued investment in support of
future business growth.
Target: to achieve a 72% global rating in 2011, with progressive
improvement to best in class.
Key Performance Indicators
Outcome: on a reported and underlying basis the ratio was
outside the target range, in part due to notable items including
restructuring costs, customer redress programmes and a bank levy
introduced by the UK government, but also due to an increase in
staff costs reflecting wage inflation in key markets and higher
average staff numbers.
Outcome: employee engagement behind global best in class.
Improvement in 2011 despite a challenging environment.