HSBC 2011 Annual Report Download - page 27
Download and view the complete annual report
Please find page 27 of the 2011 HSBC annual report below. You can navigate through the pages in the report by either clicking on the pages listed below, or by using the keyword search tool below to find specific information within the annual report.-
 1
1 -
2
-
3
-
4
-
5
-
6
-
7
-
8
-
9
-
10
-
11
-
12
-
13
-
14
-
15
-
16
-
 17
17 -
 18
18 -
 19
19 -
 20
20 -
 21
21 -
 22
22 -
 23
23 -
 24
24 -
 25
25 -
 26
26 -
 27
27 -
 28
28 -
 29
29 -
 30
30 -
 31
31 -
 32
32 -
 33
33 -
 34
34 -
 35
35 -
 36
36 -
 37
37 -
38
-
39
-
40
-
41
-
42
-
43
-
44
-
45
-
46
-
47
-
48
-
49
-
50
-
51
-
52
-
53
-
54
-
55
-
56
-
57
-
58
-
59
-
60
-
61
-
62
-
63
-
64
-
65
-
66
-
67
-
68
-
69
-
70
-
71
-
72
-
73
-
74
-
75
-
76
-
77
-
78
-
79
-
80
-
81
-
82
-
83
-
84
-
85
-
86
-
87
-
88
-
89
-
90
-
91
-
92
-
93
-
94
-
95
-
96
-
97
-
98
-
99
-
100
-
101
-
102
-
103
-
104
-
105
-
106
-
107
-
108
-
109
-
110
-
111
-
112
-
113
-
114
-
115
-
116
-
117
-
118
-
119
-
120
-
121
-
122
-
123
-
124
-
125
-
126
-
127
-
128
-
129
-
130
-
131
-
132
-
133
-
134
-
135
-
136
-
137
-
138
-
139
-
140
-
141
-
142
-
143
-
144
-
145
-
146
-
147
-
148
-
149
-
150
-
151
-
152
-
153
-
154
-
155
-
156
-
157
-
158
-
159
-
160
-
161
-
162
-
163
-
164
-
165
-
166
-
167
-
168
-
169
-
170
-
171
-
172
-
173
-
174
-
175
-
176
-
177
-
178
-
179
-
180
-
181
-
182
-
183
-
184
-
185
-
186
-
187
-
188
-
189
-
190
-
191
-
192
-
193
-
194
-
195
-
196
-
197
-
198
-
199
-
200
-
201
-
202
-
203
-
204
-
205
-
206
-
207
-
208
-
209
-
210
-
211
-
212
-
213
-
214
-
215
-
216
-
217
-
218
-
219
-
220
-
221
-
222
-
223
-
224
-
225
-
226
-
227
-
228
-
229
-
230
-
231
-
232
-
233
-
234
-
235
-
236
-
237
-
238
-
239
-
240
-
241
-
242
-
243
-
244
-
245
-
246
-
247
-
248
-
249
-
250
-
251
-
252
-
253
-
254
-
255
-
256
-
257
-
258
-
259
-
260
-
261
-
262
-
263
-
264
-
265
-
266
-
267
-
268
-
269
-
270
-
271
-
272
-
273
-
274
-
275
-
276
-
277
-
278
-
279
-
280
-
281
-
282
-
283
-
284
-
285
-
286
-
287
-
288
-
289
-
290
-
291
-
292
-
293
-
294
-
295
-
296
-
297
-
298
-
299
-
300
-
301
-
302
-
303
-
304
-
305
-
306
-
307
-
308
-
309
-
310
-
311
-
312
-
313
-
314
-
315
-
316
-
317
-
318
-
319
-
320
-
321
-
322
-
323
-
324
-
325
-
326
-
327
-
328
-
329
-
330
-
331
-
332
-
333
-
334
-
335
-
336
-
337
-
338
-
339
-
340
-
341
-
342
-
343
-
344
-
345
-
346
-
347
-
348
-
349
-
350
-
351
-
352
-
353
-
354
-
355
-
356
-
357
-
358
-
359
-
360
-
361
-
362
-
363
-
364
-
365
-
366
-
367
-
368
-
369
-
370
-
371
-
372
-
373
-
374
-
375
-
376
-
377
-
378
-
379
-
380
-
381
-
382
-
383
-
384
-
385
-
386
-
387
-
388
-
389
-
390
-
391
-
392
-
393
-
394
-
395
-
396
-
397
-
398
-
399
-
400
-
401
-
402
-
403
-
404
-
405
-
406
-
407
-
408
-
409
-
410
-
411
-
412
-
413
-
414
-
415
-
416
-
417
-
418
-
419
-
420
-
421
-
422
-
423
-
424
-
425
-
426
-
427
-
428
-
429
-
430
-
431
-
432
-
433
-
434
-
435
-
436
-
437
-
438
-
439
-
440
 |
 |

25
Overview Operating & Financial Review Corporate Governance Financial Statements Shareholder Information
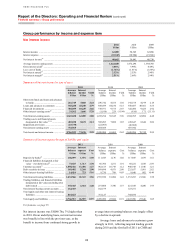
in comparison with smaller favourable fair value
movements in North America and adverse fair value
movements in Europe, both in 2010.
On an underlying basis, which excludes credit
spread-related movements in the fair value of our
own long-term debt, the equivalent figures were net
expense of US$494m in 2011 and net income of
US$1.3bn in 2010. Net expense arising from
financial assets held to meet liabilities under
insurance and investment contracts reflected net
investment losses in 2011 as a result of adverse
movements in equity markets, primarily in Europe
and Hong Kong, compared with net investment gains
experienced during 2010. This predominantly
affected the value of assets held to support unit-
linked contracts in the UK and Hong Kong,
insurance contracts with discretionary participation
features (‘DPF’) in Hong Kong, and investment
contracts with DPF in France.
The investment gains or losses arising from
equity markets resulted in a corresponding
movement in liabilities to customers, reflecting the
extent to which unit-linked policyholders, in
particular, participate in the investment performance
of the associated asset portfolio. Where these relate
to assets held to back investment contracts, the
corresponding movement in liabilities to customers is
also recorded under ‘Net income from financial
instruments designated at fair value’. This is in
contrast to gains or losses related to assets held to
back insurance contracts or investment contracts with
DPF, where the corresponding movement in
liabilities to customers is recorded under ‘Net
insurance claims incurred and movement in liabilities
to policyholders’.
Within net income from financial instruments
designated at fair value were lower adverse foreign
exchange movements than in 2010 on foreign
currency debt designated at fair value issued as part
of our overall funding strategy, with an offset from
trading assets held as economic hedges reported in
‘Net trading income’.
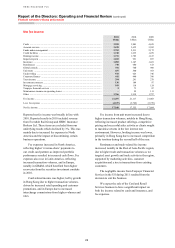
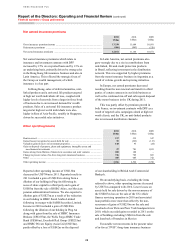
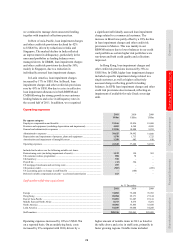
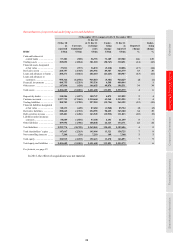
Gains less losses from financial investments
2011
US$m
2010
US$m
2009
US$m
Net gains/(losses) from disposal of:
– debt securities ...................................................................................................... 712 564 463
– equity securities ................................................................................................... 360 516 407
– other financial investments ................................................................................. 12 (7) 8
1,084 1,073 878
Impairment of available-for-sale equity securities ..................................................... (177) (105) (358)
Gains less losses from financial investments ............................................................. 907 968 520
Reported gains less losses from financial investments
decreased by US$61m to US$907m. On an
underlying basis, excluding an accounting gain of
US$62m arising from the reclassification of Bao Viet
as an associate in 2010, they declined by 4%.
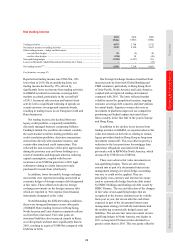
The reduction was principally driven by lower
net gains from the disposal of available-for-sale
equity securities, as deterioration in market
confidence resulted in fewer disposal opportunities
and lower gains from the sale of private equity
investments, notably in Europe. We also recognised a
gain on disposal in 2010 of an equity investment in a
Singaporean property company which did not recur.
This was partly offset by a gain on sale of shares in a
Mexican listed company.
Impairments of available-for-sale equity
securities rose, due to write downs of our equity
investments in real estate companies, reflecting a
decline in property values in 2011.
Net gains from the disposal of available-for-sale
debt securities increased in Europe and North
America following sales of government bonds and
mortgage-backed securities by Balance Sheet
Management as part of normal portfolio management
activities. However, this was offset in part by lower
net gains in Hong Kong and Rest of Asia-Pacific on
the disposal of government debt securities in 2011.