HSBC 2011 Annual Report Download - page 378
Download and view the complete annual report
Please find page 378 of the 2011 HSBC annual report below. You can navigate through the pages in the report by either clicking on the pages listed below, or by using the keyword search tool below to find specific information within the annual report.-
 1
1 -
2
-
3
-
4
-
5
-
6
-
7
-
8
-
9
-
10
-
11
-
12
-
13
-
14
-
15
-
16
-
17
-
18
-
19
-
20
-
21
-
22
-
23
-
24
-
25
-
26
-
27
-
28
-
29
-
30
-
31
-
32
-
33
-
34
-
35
-
36
-
37
-
38
-
39
-
40
-
41
-
42
-
43
-
44
-
45
-
46
-
47
-
48
-
49
-
50
-
51
-
52
-
53
-
54
-
55
-
56
-
57
-
58
-
59
-
60
-
61
-
62
-
63
-
64
-
65
-
66
-
67
-
68
-
69
-
70
-
71
-
72
-
73
-
74
-
75
-
76
-
77
-
78
-
79
-
80
-
81
-
82
-
83
-
84
-
85
-
86
-
87
-
88
-
89
-
90
-
91
-
92
-
93
-
94
-
95
-
96
-
97
-
98
-
99
-
100
-
101
-
102
-
103
-
104
-
105
-
106
-
107
-
108
-
109
-
110
-
111
-
112
-
113
-
114
-
115
-
116
-
117
-
118
-
119
-
120
-
121
-
122
-
123
-
124
-
125
-
126
-
127
-
128
-
129
-
130
-
131
-
132
-
133
-
134
-
135
-
136
-
137
-
138
-
139
-
140
-
141
-
142
-
143
-
144
-
145
-
146
-
147
-
148
-
149
-
150
-
151
-
152
-
153
-
154
-
155
-
156
-
157
-
158
-
159
-
160
-
161
-
162
-
163
-
164
-
165
-
166
-
167
-
168
-
169
-
170
-
171
-
172
-
173
-
174
-
175
-
176
-
177
-
178
-
179
-
180
-
181
-
182
-
183
-
184
-
185
-
186
-
187
-
188
-
189
-
190
-
191
-
192
-
193
-
194
-
195
-
196
-
197
-
198
-
199
-
200
-
201
-
202
-
203
-
204
-
205
-
206
-
207
-
208
-
209
-
210
-
211
-
212
-
213
-
214
-
215
-
216
-
217
-
218
-
219
-
220
-
221
-
222
-
223
-
224
-
225
-
226
-
227
-
228
-
229
-
230
-
231
-
232
-
233
-
234
-
235
-
236
-
237
-
238
-
239
-
240
-
241
-
242
-
243
-
244
-
245
-
246
-
247
-
248
-
249
-
250
-
251
-
252
-
253
-
254
-
255
-
256
-
257
-
258
-
259
-
260
-
261
-
262
-
263
-
264
-
265
-
266
-
267
-
268
-
269
-
270
-
271
-
272
-
273
-
274
-
275
-
276
-
277
-
278
-
279
-
280
-
281
-
282
-
283
-
284
-
285
-
286
-
287
-
288
-
289
-
290
-
291
-
292
-
293
-
294
-
295
-
296
-
297
-
298
-
299
-
300
-
301
-
302
-
303
-
304
-
305
-
306
-
307
-
308
-
309
-
310
-
311
-
312
-
313
-
314
-
315
-
316
-
317
-
318
-
319
-
320
-
321
-
322
-
323
-
324
-
325
-
326
-
327
-
328
-
329
-
330
-
331
-
332
-
333
-
334
-
335
-
336
-
337
-
338
-
339
-
340
-
341
-
342
-
343
-
344
-
345
-
346
-
347
-
348
-
349
-
350
-
351
-
352
-
353
-
354
-
355
-
356
-
357
-
358
-
359
-
360
-
361
-
362
-
363
-
364
-
365
-
366
-
367
-
 368
368 -
 369
369 -
 370
370 -
 371
371 -
 372
372 -
 373
373 -
 374
374 -
 375
375 -
 376
376 -
 377
377 -
 378
378 -
 379
379 -
 380
380 -
 381
381 -
 382
382 -
 383
383 -
 384
384 -
 385
385 -
 386
386 -
 387
387 -
 388
388 -
389
-
390
-
391
-
392
-
393
-
394
-
395
-
396
-
397
-
398
-
399
-
400
-
401
-
402
-
403
-
404
-
405
-
406
-
407
-
408
-
409
-
410
-
411
-
412
-
413
-
414
-
415
-
416
-
417
-
418
-
419
-
420
-
421
-
422
-
423
-
424
-
425
-
426
-
427
-
428
-
429
-
430
-
431
-
432
-
433
-
434
-
435
-
436
-
437
-
438
-
439
-
440
 |
 |

HSBC HOLDINGS PLC
Notes on the Financial Statements (continued)
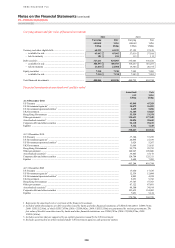
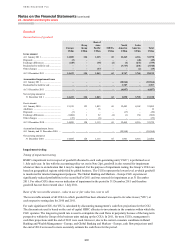
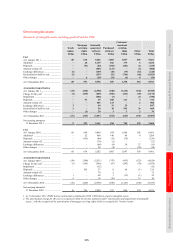
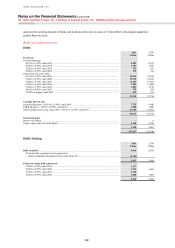
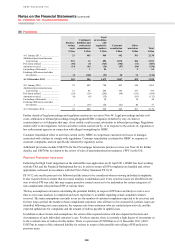
25 – Property, plant and equipment
376
25 Property, plant and equipment
Freehold
land and
buildings
Long
leasehold
land and
buildings
Short
leasehold
land and
buildings1
Equipment,
fixtures
and fittings2
Equipment
on
operating
leases
Total3
US$m US$m US$m US$m US$m US$m
Cost or fair value
At 1 January 2011 ........................................................ 3,952 1,673 4,004 12,529 53 22,211
Additions at cost4 ......................................................... 353 114 180 1,183 19 1,849
Fair value adjustments ................................................. (15) 44 89 – – 118
Disposals ...................................................................... (188) (19) (279) (1,400) – (1,886)
Reclassified to held for sale ......................................... (424) (19) (158) (260) – (861)
Transfers ...................................................................... (12) (35) 25 10 – (12)
Exchange differences ................................................... (203) 1 15 (395) (1) (583)
Other changes .............................................................. 74 41 (4) (88) – 23
At 31 December 2011 .................................................. 3,537 1,800 3,872 11,579 71 20,859
Accumulated depreciation and impairment
At 1 January 2011 ........................................................ (586) (307) (1,268) (8,506) (23) (10,690)
Depreciation charge for the year ................................. (88) (51) (211) (1,157) (9) (1,516)
Disposals ...................................................................... 60 2 262 1,319 – 1,643
Reclassified to held for sale ......................................... 133 13 80 138 – 364
Transfers ...................................................................... 5 35 (34) (6) – –
Impairment losses recognised ...................................... (13) – (16) (25) – (54)
Exchange differences ................................................... 18 (1) 8 260 1 286
Other changes .............................................................. (73) (23) (2) 68 3 (27)
At 31 December 2011 .................................................. (544) (332) (1,181) (7,909) (28) (9,994)
Net carrying amount at 31 December 2011 ................. 2,993 1,468 2,691 3,670 43 10,865
Cost or fair value
At 1 January 2010 ........................................................ 3,915 1,327 3,135 11,552 5,236 25,165
Additions at cost4 ......................................................... 349 76 632 1,456 65 2,578
Fair value adjustments ................................................. 31 24 38 – – 93
Disposals5 .................................................................... (307) (8) (82) (355) (5,113) (5,865)
Reclassified to held for sale ......................................... (73) (16) (3) (35) – (127)
Transfers ...................................................................... (47) (147) 199 (5) – –
Exchange differences ................................................... (47) (5) (17) (62) (135) (266)
Other changes .............................................................. 131 422 102 (22) – 633
At 31 December 2010 .................................................. 3,952 1,673 4,004 12,529 53 22,211
Accumulated depreciation and impairment
At 1 January 2010 ........................................................ (450) (229) (1,065) (7,743) (1,876) (11,363)
Depreciation charge for the year ................................. (91) (46) (203) (1,178) (150) (1,668)
Disposals5 .................................................................... 31 – 68 344 1,956 2,399
Reclassified to held for sale ......................................... 24 – 1 26 – 51
Transfers ...................................................................... 23 20 (43) – – –
Impairment losses recognised ...................................... (22) – 1 (24) – (45)
Exchange differences ................................................... 5 2 5 54 45 111
Other changes .............................................................. (106) (54) (32) 15 2 (175)
At 31 December 2010 .................................................. (586) (307) (1,268) (8,506) (23) (10,690)
Net carrying amount at 31 December 2010 ................. 3,366 1,366 2,736 4,023 30 11,521
1 Including assets held on finance leases with a net book value of US$7m (2010: US$11m).
2 Including assets held on finance leases with a net book value of US$210m (2010: US$204m).
3 Including assets with a net book value of US$33m (2010: US$31m) pledged as security for liabilities.
4 At 31 December 2011, HSBC had US$517m (2010: US$593m) of contractual commitments to acquire property, plant and equipment.
5 The disposals included under ‘Equipment on operating leases’ relate to the sale of a subsidiary, Eversholt Rail Group.
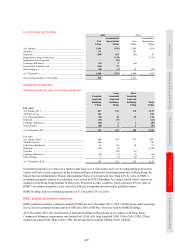
Leasehold land and buildings
Leasehold land and buildings are considered to be held under finance lease contracts where the value of the land
cannot reliably be separated from the value of the lease and the respective contracts do not meet the criteria for
classification as operating leases. Included within ‘Short leasehold land and buildings’ are the following amounts in
respect of assets classed as improvements to buildings, which are carried at depreciated historical cost: