HSBC 2011 Annual Report Download - page 175
Download and view the complete annual report
Please find page 175 of the 2011 HSBC annual report below. You can navigate through the pages in the report by either clicking on the pages listed below, or by using the keyword search tool below to find specific information within the annual report.-
 1
1 -
2
-
3
-
4
-
5
-
6
-
7
-
8
-
9
-
10
-
11
-
12
-
13
-
14
-
15
-
16
-
17
-
18
-
19
-
20
-
21
-
22
-
23
-
24
-
25
-
26
-
27
-
28
-
29
-
30
-
31
-
32
-
33
-
34
-
35
-
36
-
37
-
38
-
39
-
40
-
41
-
42
-
43
-
44
-
45
-
46
-
47
-
48
-
49
-
50
-
51
-
52
-
53
-
54
-
55
-
56
-
57
-
58
-
59
-
60
-
61
-
62
-
63
-
64
-
65
-
66
-
67
-
68
-
69
-
70
-
71
-
72
-
73
-
74
-
75
-
76
-
77
-
78
-
79
-
80
-
81
-
82
-
83
-
84
-
85
-
86
-
87
-
88
-
89
-
90
-
91
-
92
-
93
-
94
-
95
-
96
-
97
-
98
-
99
-
100
-
101
-
102
-
103
-
104
-
105
-
106
-
107
-
108
-
109
-
110
-
111
-
112
-
113
-
114
-
115
-
116
-
117
-
118
-
119
-
120
-
121
-
122
-
123
-
124
-
125
-
126
-
127
-
128
-
129
-
130
-
131
-
132
-
133
-
134
-
135
-
136
-
137
-
138
-
139
-
140
-
141
-
142
-
143
-
144
-
145
-
146
-
147
-
148
-
149
-
150
-
151
-
152
-
153
-
154
-
155
-
156
-
157
-
158
-
159
-
160
-
161
-
162
-
163
-
164
-
 165
165 -
 166
166 -
 167
167 -
 168
168 -
 169
169 -
 170
170 -
 171
171 -
 172
172 -
 173
173 -
 174
174 -
 175
175 -
 176
176 -
 177
177 -
 178
178 -
 179
179 -
 180
180 -
 181
181 -
 182
182 -
 183
183 -
 184
184 -
 185
185 -
186
-
187
-
188
-
189
-
190
-
191
-
192
-
193
-
194
-
195
-
196
-
197
-
198
-
199
-
200
-
201
-
202
-
203
-
204
-
205
-
206
-
207
-
208
-
209
-
210
-
211
-
212
-
213
-
214
-
215
-
216
-
217
-
218
-
219
-
220
-
221
-
222
-
223
-
224
-
225
-
226
-
227
-
228
-
229
-
230
-
231
-
232
-
233
-
234
-
235
-
236
-
237
-
238
-
239
-
240
-
241
-
242
-
243
-
244
-
245
-
246
-
247
-
248
-
249
-
250
-
251
-
252
-
253
-
254
-
255
-
256
-
257
-
258
-
259
-
260
-
261
-
262
-
263
-
264
-
265
-
266
-
267
-
268
-
269
-
270
-
271
-
272
-
273
-
274
-
275
-
276
-
277
-
278
-
279
-
280
-
281
-
282
-
283
-
284
-
285
-
286
-
287
-
288
-
289
-
290
-
291
-
292
-
293
-
294
-
295
-
296
-
297
-
298
-
299
-
300
-
301
-
302
-
303
-
304
-
305
-
306
-
307
-
308
-
309
-
310
-
311
-
312
-
313
-
314
-
315
-
316
-
317
-
318
-
319
-
320
-
321
-
322
-
323
-
324
-
325
-
326
-
327
-
328
-
329
-
330
-
331
-
332
-
333
-
334
-
335
-
336
-
337
-
338
-
339
-
340
-
341
-
342
-
343
-
344
-
345
-
346
-
347
-
348
-
349
-
350
-
351
-
352
-
353
-
354
-
355
-
356
-
357
-
358
-
359
-
360
-
361
-
362
-
363
-
364
-
365
-
366
-
367
-
368
-
369
-
370
-
371
-
372
-
373
-
374
-
375
-
376
-
377
-
378
-
379
-
380
-
381
-
382
-
383
-
384
-
385
-
386
-
387
-
388
-
389
-
390
-
391
-
392
-
393
-
394
-
395
-
396
-
397
-
398
-
399
-
400
-
401
-
402
-
403
-
404
-
405
-
406
-
407
-
408
-
409
-
410
-
411
-
412
-
413
-
414
-
415
-
416
-
417
-
418
-
419
-
420
-
421
-
422
-
423
-
424
-
425
-
426
-
427
-
428
-
429
-
430
-
431
-
432
-
433
-
434
-
435
-
436
-
437
-
438
-
439
-
440
 |
 |

173
Overview Operating & Financial Review Corporate Governance Financial Statements Shareholder Information
Europe
Hong
Kong
Rest of
Asia-
Pacific
North
America
Latin
America
Total
US$m US$m US$m US$m US$m US$m
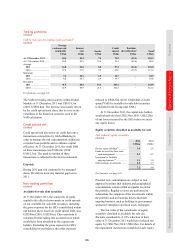
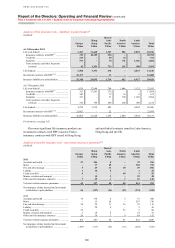
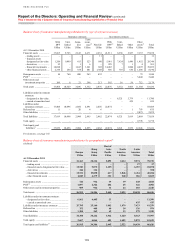
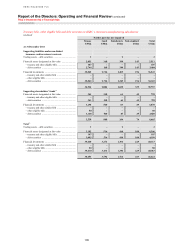
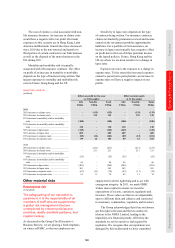
2009
Accident and health ............................................ 94 160 7 3 23 287
Motor .................................................................. 123 14 20 – 234 391
Fire and other damage ........................................ 72 22 8 16 22 140
Liability ............................................................... – 15 4 – 2 21
Credit (non-life) .................................................. 35 – – 86 – 121
Marine, aviation and transport ............................ 7 9 4 – 17 37
Other non-life insurance contracts ..................... 24 32 1 12 58 127
Total net written insurance premiums ................ 355 252 44 117 356 1,124
Net insurance claims incurred and movement
in liabilities to policyholders .......................... (748) (107) (17) (96) (155) (1,123)
For footnotes, see page 185.
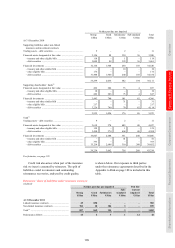
(Audited)
Our motor business is written predominantly in
Argentina. The UK motor book continued to run off
and the business was sold in September 2011.
Our accident and health and fire and other
damage to property contracts are written in all
regions but mainly in Hong Kong.
Credit non-life insurance, which was historically
originated in conjunction with the provision of loans,
is concentrated in the US.
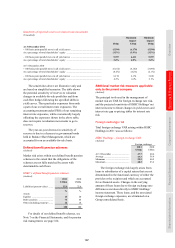
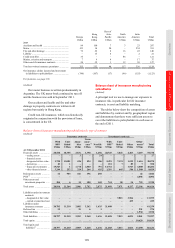
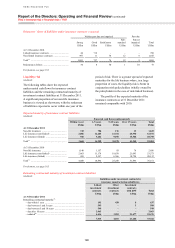
Balance sheet of insurance manufacturing
subsidiaries
(Audited)
A principal tool we use to manage our exposure to
insurance risk, in particular for life insurance
contracts, is asset and liability matching.
The tables below show the composition of assets
and liabilities by contract and by geographical region
and demonstrate that there were sufficient assets to
cover the liabilities to policyholders in each case at
the end of 2011.
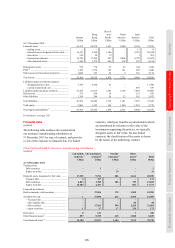
Balance sheet of insurance manufacturing subsidiaries by type of contract
(Audited)
Insurance contracts Investment contracts
With
DPF
Unit-
linked
Annu-
ities
Term
assur-
ance70
Non-life
With
DPF68
Unit-
linked
Other
Other
assets71 Total
US$m US$m US$m US$m US$m US$m US$m US$m US$m US$m
At 31 December 2011
Financial assets .................. 20,520 10,355 2,531 3,398 1,656 20,745 7,843 4,103 7,219 78,370
– trading assets ................ – – 3– 24 – – – – 27
– financial assets
designated at fair value . 1,730 10,101 426 594 206 5,491 7,191 1,515 1,616 28,870
– derivatives .................... 23 1 –– –231 7 89 7 358
– financial investments ... 15,523 1 1,778 2,540 791 13,732 – 1,913 4,008 40,286
– other financial assets .... 3,244 252 324 264 635 1,291 645 586 1,588 8,829
Reinsurance assets ............. 12 903 441 196 250 – – – 42 1,844
PVIF72 ................................ – – – – – – – – 4,092 4,092
Other assets and
investment properties ...... 384 6 14 188 169 744 28 34 753 2,320
Total assets ......................... 20,916 11,264 2,986 3,782 2,075 21,489 7,871 4,137 12,106 86,626
Liabilities under investment
contracts:
– designated at fair value – – – – – – 7,813 3,586 – 11,399
– carried at amortised cost – – – – – – – 435 – 435
Liabilities under
insurance contracts .......... 20,782 11,210 2,882 3,262 1,635 21,488 – – – 61,259
Deferred tax ....................... 15 – 21 6 1 – – – 931 974
Other liabilities .................. – – – – – – – – 1,930 1,930
Total liabilities ................... 20,797 11,210 2,903 3,268 1,636 21,488 7,813 4,021 2,861 75,997
Total equity ........................ – – – – – – – – 10,629 10,629
Total equity and
liabilities73 ...................... 20,797 11,210 2,903 3,268 1,636 21,488 7,813 4,021 13,490 86,626