HSBC 2011 Annual Report Download - page 348
Download and view the complete annual report
Please find page 348 of the 2011 HSBC annual report below. You can navigate through the pages in the report by either clicking on the pages listed below, or by using the keyword search tool below to find specific information within the annual report.-
 1
1 -
2
-
3
-
4
-
5
-
6
-
7
-
8
-
9
-
10
-
11
-
12
-
13
-
14
-
15
-
16
-
17
-
18
-
19
-
20
-
21
-
22
-
23
-
24
-
25
-
26
-
27
-
28
-
29
-
30
-
31
-
32
-
33
-
34
-
35
-
36
-
37
-
38
-
39
-
40
-
41
-
42
-
43
-
44
-
45
-
46
-
47
-
48
-
49
-
50
-
51
-
52
-
53
-
54
-
55
-
56
-
57
-
58
-
59
-
60
-
61
-
62
-
63
-
64
-
65
-
66
-
67
-
68
-
69
-
70
-
71
-
72
-
73
-
74
-
75
-
76
-
77
-
78
-
79
-
80
-
81
-
82
-
83
-
84
-
85
-
86
-
87
-
88
-
89
-
90
-
91
-
92
-
93
-
94
-
95
-
96
-
97
-
98
-
99
-
100
-
101
-
102
-
103
-
104
-
105
-
106
-
107
-
108
-
109
-
110
-
111
-
112
-
113
-
114
-
115
-
116
-
117
-
118
-
119
-
120
-
121
-
122
-
123
-
124
-
125
-
126
-
127
-
128
-
129
-
130
-
131
-
132
-
133
-
134
-
135
-
136
-
137
-
138
-
139
-
140
-
141
-
142
-
143
-
144
-
145
-
146
-
147
-
148
-
149
-
150
-
151
-
152
-
153
-
154
-
155
-
156
-
157
-
158
-
159
-
160
-
161
-
162
-
163
-
164
-
165
-
166
-
167
-
168
-
169
-
170
-
171
-
172
-
173
-
174
-
175
-
176
-
177
-
178
-
179
-
180
-
181
-
182
-
183
-
184
-
185
-
186
-
187
-
188
-
189
-
190
-
191
-
192
-
193
-
194
-
195
-
196
-
197
-
198
-
199
-
200
-
201
-
202
-
203
-
204
-
205
-
206
-
207
-
208
-
209
-
210
-
211
-
212
-
213
-
214
-
215
-
216
-
217
-
218
-
219
-
220
-
221
-
222
-
223
-
224
-
225
-
226
-
227
-
228
-
229
-
230
-
231
-
232
-
233
-
234
-
235
-
236
-
237
-
238
-
239
-
240
-
241
-
242
-
243
-
244
-
245
-
246
-
247
-
248
-
249
-
250
-
251
-
252
-
253
-
254
-
255
-
256
-
257
-
258
-
259
-
260
-
261
-
262
-
263
-
264
-
265
-
266
-
267
-
268
-
269
-
270
-
271
-
272
-
273
-
274
-
275
-
276
-
277
-
278
-
279
-
280
-
281
-
282
-
283
-
284
-
285
-
286
-
287
-
288
-
289
-
290
-
291
-
292
-
293
-
294
-
295
-
296
-
297
-
298
-
299
-
300
-
301
-
302
-
303
-
304
-
305
-
306
-
307
-
308
-
309
-
310
-
311
-
312
-
313
-
314
-
315
-
316
-
317
-
318
-
319
-
320
-
321
-
322
-
323
-
324
-
325
-
326
-
327
-
328
-
329
-
330
-
331
-
332
-
333
-
334
-
335
-
336
-
337
-
 338
338 -
 339
339 -
 340
340 -
 341
341 -
 342
342 -
 343
343 -
 344
344 -
 345
345 -
 346
346 -
 347
347 -
 348
348 -
 349
349 -
 350
350 -
 351
351 -
 352
352 -
 353
353 -
 354
354 -
 355
355 -
 356
356 -
 357
357 -
 358
358 -
359
-
360
-
361
-
362
-
363
-
364
-
365
-
366
-
367
-
368
-
369
-
370
-
371
-
372
-
373
-
374
-
375
-
376
-
377
-
378
-
379
-
380
-
381
-
382
-
383
-
384
-
385
-
386
-
387
-
388
-
389
-
390
-
391
-
392
-
393
-
394
-
395
-
396
-
397
-
398
-
399
-
400
-
401
-
402
-
403
-
404
-
405
-
406
-
407
-
408
-
409
-
410
-
411
-
412
-
413
-
414
-
415
-
416
-
417
-
418
-
419
-
420
-
421
-
422
-
423
-
424
-
425
-
426
-
427
-
428
-
429
-
430
-
431
-
432
-
433
-
434
-
435
-
436
-
437
-
438
-
439
-
440
 |
 |

HSBC HOLDINGS PLC
Notes on the Financial Statements (continued)
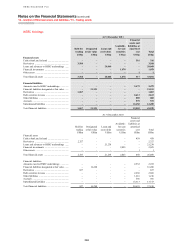
15 – Trading assets / 16 – Fair values of financial instruments carried at fair value
346
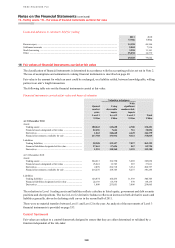
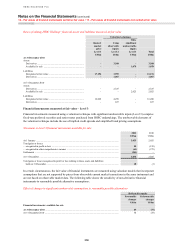
Loans and advances to customers held for trading
2011 2010
US$m US$m
Reverse repos ......................................................................................................................................... 34,358 46,366
Settlement accounts ............................................................................................................................... 5,804 7,516
Stock borrowing .................................................................................................................................... 3,928 11,161
Other ...................................................................................................................................................... 25,038 14,579
69,128 79,622
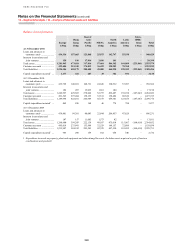
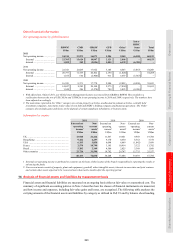
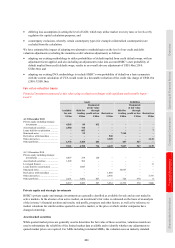
16 Fair values of financial instruments carried at fair value
The classification of financial instruments is determined in accordance with the accounting policies set out in Note 2.
The use of assumptions and estimation in valuing financial instruments is described on page 40.
Fair value is the amount for which an asset could be exchanged, or a liability settled, between knowledgeable, willing
parties in an arm’s length transaction.
The following table sets out the financial instruments carried at fair value.
Financial instruments carried at fair value and bases of valuation
Valuation techniques
Quoted
market
price
Level 1
Using
observable
inputs
Level 2
With
significant
unobservable
inputs
Level 3 Total
US$m US$m US$m US$m
At 31 December 2011
Assets
Trading assets ........................................................................ 180,043 145,628 4,780 330,451
Financial assets designated at fair value ............................... 22,496 7,644 716 30,856
Derivatives ............................................................................. 1,262 340,668 4,449 346,379
Financial investments: available for sale .............................. 217,788 151,936 9,121 378,845
Liabilities
Trading liabilities .................................................................. 98,208 159,157 7,827 265,192
Financial liabilities designated at fair value .......................... 27,461 57,696 567 85,724
Derivatives ............................................................................. 1,991 340,260 3,129 345,380
At 31 December 2010
Assets
Trading assets ........................................................................ 224,613 154,750 5,689 385,052
Financial assets designated at fair value ............................... 23,641 12,783 587 37,011
Derivatives ............................................................................. 2,078 254,718 3,961 260,757
Financial investments: available for sale .............................. 214,276 158,743 8,237 381,256
Liabilities
Trading liabilities .................................................................. 124,874 164,436 11,393 300,703
Financial liabilities designated at fair value .......................... 22,193 65,370 570 88,133
Derivatives ............................................................................. 1,808 253,051 3,806 258,665
The reduction in Level 1 trading assets and liabilities reflects a decline in listed equity, government and debt security
positions and short positions. The rise in Level 2 derivative balances reflects an increase in both derivative assets and
liabilities generally, driven by declining yield curves in the second half of 2011.
There were no material transfers between Level 1 and Level 2 in the year. An analysis of the movements of Level 3
financial instruments is provided on page 353.
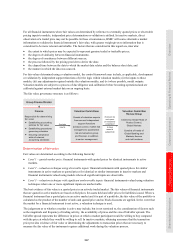
Control framework
Fair values are subject to a control framework designed to ensure that they are either determined or validated by a
function independent of the risk-taker.