HSBC 2011 Annual Report Download - page 34
Download and view the complete annual report
Please find page 34 of the 2011 HSBC annual report below. You can navigate through the pages in the report by either clicking on the pages listed below, or by using the keyword search tool below to find specific information within the annual report.-
 1
1 -
2
-
3
-
4
-
5
-
6
-
7
-
8
-
9
-
10
-
11
-
12
-
13
-
14
-
15
-
16
-
17
-
18
-
19
-
20
-
21
-
22
-
23
-
 24
24 -
 25
25 -
 26
26 -
 27
27 -
 28
28 -
 29
29 -
 30
30 -
 31
31 -
 32
32 -
 33
33 -
 34
34 -
 35
35 -
 36
36 -
 37
37 -
 38
38 -
 39
39 -
 40
40 -
 41
41 -
 42
42 -
 43
43 -
 44
44 -
45
-
46
-
47
-
48
-
49
-
50
-
51
-
52
-
53
-
54
-
55
-
56
-
57
-
58
-
59
-
60
-
61
-
62
-
63
-
64
-
65
-
66
-
67
-
68
-
69
-
70
-
71
-
72
-
73
-
74
-
75
-
76
-
77
-
78
-
79
-
80
-
81
-
82
-
83
-
84
-
85
-
86
-
87
-
88
-
89
-
90
-
91
-
92
-
93
-
94
-
95
-
96
-
97
-
98
-
99
-
100
-
101
-
102
-
103
-
104
-
105
-
106
-
107
-
108
-
109
-
110
-
111
-
112
-
113
-
114
-
115
-
116
-
117
-
118
-
119
-
120
-
121
-
122
-
123
-
124
-
125
-
126
-
127
-
128
-
129
-
130
-
131
-
132
-
133
-
134
-
135
-
136
-
137
-
138
-
139
-
140
-
141
-
142
-
143
-
144
-
145
-
146
-
147
-
148
-
149
-
150
-
151
-
152
-
153
-
154
-
155
-
156
-
157
-
158
-
159
-
160
-
161
-
162
-
163
-
164
-
165
-
166
-
167
-
168
-
169
-
170
-
171
-
172
-
173
-
174
-
175
-
176
-
177
-
178
-
179
-
180
-
181
-
182
-
183
-
184
-
185
-
186
-
187
-
188
-
189
-
190
-
191
-
192
-
193
-
194
-
195
-
196
-
197
-
198
-
199
-
200
-
201
-
202
-
203
-
204
-
205
-
206
-
207
-
208
-
209
-
210
-
211
-
212
-
213
-
214
-
215
-
216
-
217
-
218
-
219
-
220
-
221
-
222
-
223
-
224
-
225
-
226
-
227
-
228
-
229
-
230
-
231
-
232
-
233
-
234
-
235
-
236
-
237
-
238
-
239
-
240
-
241
-
242
-
243
-
244
-
245
-
246
-
247
-
248
-
249
-
250
-
251
-
252
-
253
-
254
-
255
-
256
-
257
-
258
-
259
-
260
-
261
-
262
-
263
-
264
-
265
-
266
-
267
-
268
-
269
-
270
-
271
-
272
-
273
-
274
-
275
-
276
-
277
-
278
-
279
-
280
-
281
-
282
-
283
-
284
-
285
-
286
-
287
-
288
-
289
-
290
-
291
-
292
-
293
-
294
-
295
-
296
-
297
-
298
-
299
-
300
-
301
-
302
-
303
-
304
-
305
-
306
-
307
-
308
-
309
-
310
-
311
-
312
-
313
-
314
-
315
-
316
-
317
-
318
-
319
-
320
-
321
-
322
-
323
-
324
-
325
-
326
-
327
-
328
-
329
-
330
-
331
-
332
-
333
-
334
-
335
-
336
-
337
-
338
-
339
-
340
-
341
-
342
-
343
-
344
-
345
-
346
-
347
-
348
-
349
-
350
-
351
-
352
-
353
-
354
-
355
-
356
-
357
-
358
-
359
-
360
-
361
-
362
-
363
-
364
-
365
-
366
-
367
-
368
-
369
-
370
-
371
-
372
-
373
-
374
-
375
-
376
-
377
-
378
-
379
-
380
-
381
-
382
-
383
-
384
-
385
-
386
-
387
-
388
-
389
-
390
-
391
-
392
-
393
-
394
-
395
-
396
-
397
-
398
-
399
-
400
-
401
-
402
-
403
-
404
-
405
-
406
-
407
-
408
-
409
-
410
-
411
-
412
-
413
-
414
-
415
-
416
-
417
-
418
-
419
-
420
-
421
-
422
-
423
-
424
-
425
-
426
-
427
-
428
-
429
-
430
-
431
-
432
-
433
-
434
-
435
-
436
-
437
-
438
-
439
-
440
 |
 |

HSBC HOLDINGS PLC
Report of the Directors: Operating and Financial Review (continued)
Financial summary > Consolidated balance sheet
32
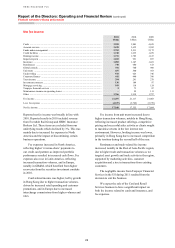
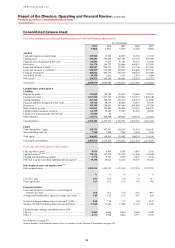
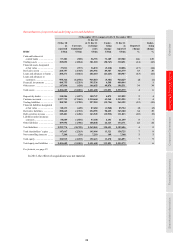
Consolidated balance sheet
Five-year summary consolidated balance sheet and selected financial information
At 31 December
2011
US$m
2010
US$m
2009
US$m
2008
US$m
2007
US$m
ASSETS
Cash and balances at central banks ............................................. 129,902 57,383 60,655 52,396 21,765
Trading assets .............................................................................. 330,451 385,052 421,381 427,329 445,968
Financial assets designated at fair value ..................................... 30,856 37,011 37,181 28,533 41,564
Derivatives ................................................................................... 346,379 260,757 250,886 494,876 187,854
Loans and advances to banks ...................................................... 180,987 208,271 179,781 153,766 237,366
Loans and advances to customers37 ............................................. 940,429 958,366 896,231 932,868 981,548
Financial investments .................................................................. 400,044 400,755 369,158 300,235 283,000
Assets held for sale ...................................................................... 39,558 1,991 3,118 2,075 2,804
Other assets .................................................................................. 156,973 145,103 146,061 135,387 152,397
Total assets .................................................................................. 2,555,579 2,454,689 2,364,452 2,527,465 2,354,266
LIABILITIES AND EQUITY
Liabilities
Deposits by banks ........................................................................ 112,822 110,584 124,872 130,084 132,181
Customer accounts ....................................................................... 1,253,925 1,227,725 1,159,034 1,115,327 1,096,140
Trading liabilities ......................................................................... 265,192 300,703 268,130 247,652 314,580
Financial liabilities designated at fair value ................................ 85,724 88,133 80,092 74,587 89,939
Derivatives ................................................................................... 345,380 258,665 247,646 487,060 183,393
Debt securities in issue ................................................................ 131,013 145,401 146,896 179,693 246,579
Liabilities under insurance contracts ........................................... 61,259 58,609 53,707 43,683 42,606
Liabilities of disposal groups held for sale ................................. 22,200 86 3 – –
Other liabilities ............................................................................ 111,971 109,868 148,411 149,150 113,432
Total liabilities ............................................................................. 2,389,486 2,299,774 2,228,791 2,427,236 2,218,850
Equity
Total shareholders’ equity ........................................................... 158,725 147,667 128,299 93,591 128,160
Non-controlling interests ............................................................. 7,368 7,248 7,362 6,638 7,256
Total equity .................................................................................. 166,093 154,915 135,661 100,229 135,416
Total equity and liabilities ........................................................... 2,555,579 2,454,689 2,364,452 2,527,465 2,354,266
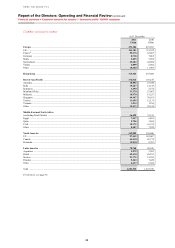
Five-year selected financial information
Called up share capital ................................................................. 8,934 8,843 8,705 6,053 5,915
Capital resources38,39,40 ................................................................. 170,334 167,555 155,729 131,460 152,640
Undated subordinated loan capital .............................................. 2,779 2,781 2,785 2,843 2,922
Preferred securities and dated subordinated loan capital41 ......... 49,438 54,421 52,126 50,307 49,472
Risk-weighted assets and capital ratios38,39
Risk-weighted assets ................................................................... 1,209,514 1,103,113 1,133,168 1,147,974 1,123,782
% % % % %
Core tier 1 ratio ............................................................................ 10.1 10.5 9.4 7.0 8.1
Total capital ratio ......................................................................... 14.1 15.2 13.7 11.4 13.6
Financial statistics
Loans and advances to customers as a percentage of
customer accounts ................................................................... 75.0 78.1 77.3
83.6 89.5
Average total shareholders’ equity to average total assets ......... 5.64 5.53 4.72 4.87 5.69
Net asset value per ordinary share at year-end42 (US$) .............. 8.48 7.94 7.17 7.44 10.72
Number of US$0.50 ordinary shares in issue (millions) ............. 17,868 17,686 17,408 12,105 11,829
Closing foreign exchange translation rates to US$:
US$1: £ ........................................................................................ 0.646 0.644 0.616 0.686 0.498
US$1: € ........................................................................................ 0.773 0.748 0.694 0.717 0.679
For footnotes, see page 95.
A more detailed consolidated balance sheet is contained in the Financial Statements on page 281.