HSBC 2011 Annual Report Download - page 21
Download and view the complete annual report
Please find page 21 of the 2011 HSBC annual report below. You can navigate through the pages in the report by either clicking on the pages listed below, or by using the keyword search tool below to find specific information within the annual report.-
 1
1 -
2
-
3
-
4
-
5
-
6
-
7
-
8
-
9
-
10
-
 11
11 -
 12
12 -
 13
13 -
 14
14 -
 15
15 -
 16
16 -
 17
17 -
 18
18 -
 19
19 -
 20
20 -
 21
21 -
 22
22 -
 23
23 -
 24
24 -
 25
25 -
 26
26 -
 27
27 -
 28
28 -
 29
29 -
 30
30 -
 31
31 -
32
-
33
-
34
-
35
-
36
-
37
-
38
-
39
-
40
-
41
-
42
-
43
-
44
-
45
-
46
-
47
-
48
-
49
-
50
-
51
-
52
-
53
-
54
-
55
-
56
-
57
-
58
-
59
-
60
-
61
-
62
-
63
-
64
-
65
-
66
-
67
-
68
-
69
-
70
-
71
-
72
-
73
-
74
-
75
-
76
-
77
-
78
-
79
-
80
-
81
-
82
-
83
-
84
-
85
-
86
-
87
-
88
-
89
-
90
-
91
-
92
-
93
-
94
-
95
-
96
-
97
-
98
-
99
-
100
-
101
-
102
-
103
-
104
-
105
-
106
-
107
-
108
-
109
-
110
-
111
-
112
-
113
-
114
-
115
-
116
-
117
-
118
-
119
-
120
-
121
-
122
-
123
-
124
-
125
-
126
-
127
-
128
-
129
-
130
-
131
-
132
-
133
-
134
-
135
-
136
-
137
-
138
-
139
-
140
-
141
-
142
-
143
-
144
-
145
-
146
-
147
-
148
-
149
-
150
-
151
-
152
-
153
-
154
-
155
-
156
-
157
-
158
-
159
-
160
-
161
-
162
-
163
-
164
-
165
-
166
-
167
-
168
-
169
-
170
-
171
-
172
-
173
-
174
-
175
-
176
-
177
-
178
-
179
-
180
-
181
-
182
-
183
-
184
-
185
-
186
-
187
-
188
-
189
-
190
-
191
-
192
-
193
-
194
-
195
-
196
-
197
-
198
-
199
-
200
-
201
-
202
-
203
-
204
-
205
-
206
-
207
-
208
-
209
-
210
-
211
-
212
-
213
-
214
-
215
-
216
-
217
-
218
-
219
-
220
-
221
-
222
-
223
-
224
-
225
-
226
-
227
-
228
-
229
-
230
-
231
-
232
-
233
-
234
-
235
-
236
-
237
-
238
-
239
-
240
-
241
-
242
-
243
-
244
-
245
-
246
-
247
-
248
-
249
-
250
-
251
-
252
-
253
-
254
-
255
-
256
-
257
-
258
-
259
-
260
-
261
-
262
-
263
-
264
-
265
-
266
-
267
-
268
-
269
-
270
-
271
-
272
-
273
-
274
-
275
-
276
-
277
-
278
-
279
-
280
-
281
-
282
-
283
-
284
-
285
-
286
-
287
-
288
-
289
-
290
-
291
-
292
-
293
-
294
-
295
-
296
-
297
-
298
-
299
-
300
-
301
-
302
-
303
-
304
-
305
-
306
-
307
-
308
-
309
-
310
-
311
-
312
-
313
-
314
-
315
-
316
-
317
-
318
-
319
-
320
-
321
-
322
-
323
-
324
-
325
-
326
-
327
-
328
-
329
-
330
-
331
-
332
-
333
-
334
-
335
-
336
-
337
-
338
-
339
-
340
-
341
-
342
-
343
-
344
-
345
-
346
-
347
-
348
-
349
-
350
-
351
-
352
-
353
-
354
-
355
-
356
-
357
-
358
-
359
-
360
-
361
-
362
-
363
-
364
-
365
-
366
-
367
-
368
-
369
-
370
-
371
-
372
-
373
-
374
-
375
-
376
-
377
-
378
-
379
-
380
-
381
-
382
-
383
-
384
-
385
-
386
-
387
-
388
-
389
-
390
-
391
-
392
-
393
-
394
-
395
-
396
-
397
-
398
-
399
-
400
-
401
-
402
-
403
-
404
-
405
-
406
-
407
-
408
-
409
-
410
-
411
-
412
-
413
-
414
-
415
-
416
-
417
-
418
-
419
-
420
-
421
-
422
-
423
-
424
-
425
-
426
-
427
-
428
-
429
-
430
-
431
-
432
-
433
-
434
-
435
-
436
-
437
-
438
-
439
-
440
 |
 |

19
Overview Operating & Financial Review Corporate Governance Financial Statements Shareholder Information
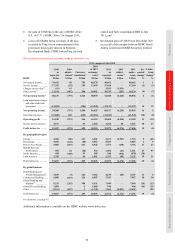
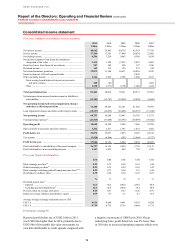
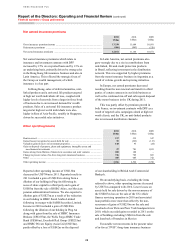
partly offset by lower loan impairment charges and other
credit risk provisions.
The results of the Group continued to be
adversely affected by the losses in the US consumer
finance business, which were US$2.4bn in 2011 and
US$2.2bn in 2010. We have agreed to sell the
profitable US Card and Retail Services portfolio,
with the remainder of the loss-making US consumer
finance business being run down. We expect the sale
of this business to have a significant impact on both
revenue and profitability in North America for the
foreseeable future.
The difference between reported and underlying
results is explained on page 16. Except where stated
otherwise, the commentaries in the Financial
Summary are on an underlying basis and references
to HSBC Finance Corporation (‘HSBC Finance’) and
HSBC Bank USA N.A. (‘HSBC Bank USA’) are on
a management basis, rather than a legal entity basis.
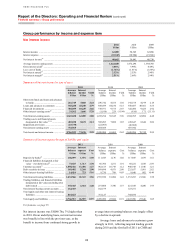
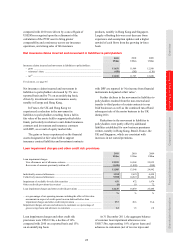
Net operating income before loan impairment
charges and other credit risk provisions (‘revenue’)
was broadly in line with 2010, due to the adverse
effect on GB&M revenue in Europe of the turmoil in
the eurozone sovereign debt market and a decline in
lending balances in RBWM in North America being
offset by revenue growth in faster-growing regions.
The eurozone turmoil resulted in lower trading
income from our Credit and Rates businesses as
problems escalated, particularly in the second half of
2011. Our GB&M performance was also affected by
lower revenues in Balance Sheet Management, as
higher yielding positions matured and interest rates
remained low, and in our legacy credit portfolio
(see page 23). In North America, we continued
to reposition our business and we remained focused
on managing down our run-off portfolios. As a
consequence, revenue fell, reflecting declining
customer loan balances in the run-off portfolios
and in the Card and Retail Services businesses.
These factors were broadly offset by increased
net interest income in CMB as a result of strong
balance sheet growth in 2010 which continued into
2011, albeit at a slower pace during the latter part of
the year. Revenue also benefited from balance sheet
growth in RBWM in Rest of Asia-Pacific and Latin
America. There were also strong performances in
over half of our business lines in GB&M, including
Global Banking, Foreign Exchange and Equities,
particularly in the faster growing regions of Rest of
Asia-Pacific and Latin America.
Loan impairment charges and other credit risk
provisions were considerably lower than in 2010,
with decreases across all regions except Latin
America and Hong Kong. The most significant
decline in loan impairment charges was in RBWM
in North America, reflecting lower balances in our
consumer finance portfolios and lower lending
balances and improved credit quality in Card and
Retail Services. There was also a notable decline in
loan impairment charges in Europe, due to successful
initiatives taken to mitigate risk within RBWM
which resulted in a reduction in delinquency rates in
personal lending in the UK. Loan impairment charges
and other credit risk provisions fell in the Middle
East in GB&M due to the non-recurrence of
restructuring activity for a small number of large
customers. In Latin America, loan impairment
charges and other credit risk provisions increased as a
result of strong lending growth in RBWM and CMB,
along with a rise in delinquency rates in Brazil during
the second half of 2011.
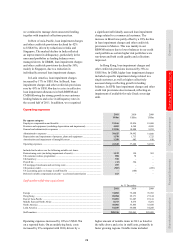
Operating expenses were higher than in 2010,
reflecting an increase in notable items and higher
staff costs in faster-growing regions. Notable items
included restructuring costs of US$1.1bn, a bank
levy introduced by the UK government of US$570m,
higher provisions relating to customer redress
programmes of US$898m and US mortgage
servicing costs of US$257m. The restructuring costs
were incurred as a result of actions taken following
the review of our capital deployment and operational
effectiveness. This led to a reduction of more than
7,600 FTEs during the second half of 2011 and
sustainable savings of US$0.9bn. These notable
items were partially offset by a credit of US$587m
resulting from a change in the inflation measure used
to calculate the defined benefit obligation of the
HSBC Bank plc (‘HSBC Bank’) UK defined benefit
plan for deferred pensions.
Income from associates increased, mainly driven
by strong results in our mainland China associates.
The contribution from Bank of Communications Co.,
Limited (‘BoCom’) rose due to loan growth, wider
deposit spreads and higher fee income. Our share of
profits from Industrial Bank Co. Limited (‘Industrial
Bank’) rose due to strong growth in customer lending
and an increase in fee-based revenue.
The reported profit after tax was US$3.8bn or
26% higher, due to the increase in taxable profits,
primarily from movements on the fair value of own
debt and a lower tax expense. This reflected the
inclusion in 2011 of a deferred tax benefit now
eligible to be recognised in respect of foreign tax
credits. In addition, the tax charge in 2010 included
US$1.2bn attributable to a taxable gain from an
internal reorganisation in North America. As a result
of these factors, the effective tax rate for 2011 was
18% compared with 25.5% in 2010.