HSBC 2011 Annual Report Download - page 115
Download and view the complete annual report
Please find page 115 of the 2011 HSBC annual report below. You can navigate through the pages in the report by either clicking on the pages listed below, or by using the keyword search tool below to find specific information within the annual report.-
 1
1 -
 2
2 -
 3
3 -
 4
4 -
 5
5 -
 6
6 -
 7
7 -
 8
8 -
 9
9 -
 10
10 -
 11
11 -
 12
12 -
 13
13 -
 14
14 -
 15
15 -
 16
16 -
 17
17 -
 18
18 -
 19
19 -
 20
20 -
 21
21 -
 22
22 -
 23
23 -
 24
24 -
 25
25 -
 26
26 -
 27
27 -
 28
28 -
 29
29 -
 30
30 -
 31
31 -
 32
32 -
 33
33 -
 34
34 -
 35
35 -
 36
36 -
 37
37 -
 38
38 -
 39
39 -
 40
40 -
 41
41 -
 42
42 -
 43
43 -
 44
44 -
 45
45 -
 46
46 -
 47
47 -
 48
48 -
 49
49 -
 50
50 -
 51
51 -
 52
52 -
 53
53 -
 54
54 -
 55
55 -
 56
56 -
 57
57 -
 58
58 -
 59
59 -
 60
60 -
 61
61 -
 62
62 -
 63
63 -
 64
64 -
 65
65 -
 66
66 -
 67
67 -
 68
68 -
 69
69 -
 70
70 -
 71
71 -
 72
72 -
 73
73 -
 74
74 -
 75
75 -
 76
76 -
 77
77 -
 78
78 -
 79
79 -
 80
80 -
 81
81 -
 82
82 -
 83
83 -
 84
84 -
 85
85 -
 86
86 -
 87
87 -
 88
88 -
 89
89 -
 90
90 -
 91
91 -
 92
92 -
 93
93 -
 94
94 -
 95
95 -
 96
96 -
 97
97 -
 98
98 -
 99
99 -
 100
100 -
 101
101 -
 102
102 -
 103
103 -
 104
104 -
 105
105 -
 106
106 -
 107
107 -
 108
108 -
 109
109 -
 110
110 -
 111
111 -
 112
112 -
 113
113 -
 114
114 -
 115
115 -
 116
116 -
 117
117 -
 118
118 -
 119
119 -
 120
120 -
 121
121 -
 122
122 -
 123
123 -
 124
124 -
 125
125 -
 126
126 -
 127
127 -
 128
128 -
 129
129 -
 130
130 -
 131
131 -
 132
132 -
 133
133 -
 134
134 -
 135
135 -
 136
136 -
 137
137 -
 138
138 -
 139
139 -
 140
140 -
 141
141 -
 142
142 -
 143
143 -
 144
144 -
 145
145 -
 146
146 -
 147
147 -
 148
148 -
 149
149 -
 150
150 -
 151
151 -
 152
152 -
 153
153 -
 154
154 -
 155
155 -
 156
156 -
 157
157 -
 158
158 -
 159
159 -
 160
160 -
 161
161 -
 162
162 -
 163
163 -
 164
164 -
 165
165 -
 166
166 -
 167
167 -
 168
168 -
 169
169 -
 170
170 -
 171
171 -
 172
172 -
 173
173 -
 174
174 -
 175
175 -
 176
176 -
 177
177 -
 178
178 -
 179
179 -
 180
180 -
 181
181 -
 182
182 -
 183
183 -
 184
184 -
 185
185 -
 186
186 -
 187
187 -
 188
188 -
 189
189 -
 190
190 -
 191
191 -
 192
192 -
 193
193 -
 194
194 -
 195
195 -
 196
196 -
 197
197 -
 198
198 -
 199
199 -
 200
200 -
 201
201 -
 202
202 -
 203
203 -
 204
204 -
 205
205 -
 206
206 -
 207
207 -
 208
208 -
 209
209 -
 210
210 -
 211
211 -
 212
212 -
 213
213 -
 214
214 -
 215
215 -
 216
216 -
 217
217 -
 218
218 -
 219
219 -
 220
220 -
 221
221 -
 222
222 -
 223
223 -
 224
224 -
 225
225 -
 226
226 -
 227
227 -
 228
228 -
 229
229 -
 230
230 -
 231
231 -
 232
232 -
 233
233 -
 234
234 -
 235
235 -
 236
236 -
 237
237 -
 238
238 -
 239
239 -
 240
240 -
 241
241 -
 242
242 -
 243
243 -
 244
244 -
 245
245 -
 246
246 -
 247
247 -
 248
248 -
 249
249 -
 250
250 -
 251
251 -
 252
252 -
 253
253 -
 254
254 -
 255
255 -
 256
256 -
 257
257 -
 258
258 -
 259
259 -
 260
260 -
 261
261 -
 262
262 -
 263
263 -
 264
264 -
 265
265 -
 266
266 -
 267
267 -
 268
268 -
 269
269 -
 270
270 -
 271
271 -
 272
272 -
 273
273 -
 274
274 -
 275
275 -
 276
276 -
 277
277 -
 278
278 -
 279
279 -
 280
280 -
 281
281 -
 282
282 -
 283
283 -
 284
284 -
 285
285 -
 286
286 -
 287
287 -
 288
288 -
 289
289 -
 290
290 -
 291
291 -
 292
292 -
 293
293 -
 294
294 -
 295
295 -
 296
296 -
 297
297 -
 298
298 -
 299
299 -
 300
300 -
 301
301 -
 302
302 -
 303
303 -
 304
304 -
 305
305 -
 306
306 -
 307
307 -
 308
308 -
 309
309 -
 310
310 -
 311
311 -
 312
312 -
 313
313 -
 314
314 -
 315
315 -
 316
316 -
 317
317 -
 318
318 -
 319
319 -
 320
320 -
 321
321 -
 322
322 -
 323
323 -
 324
324 -
 325
325 -
 326
326 -
 327
327 -
 328
328 -
 329
329 -
 330
330 -
 331
331 -
 332
332 -
 333
333 -
 334
334 -
 335
335 -
 336
336 -
 337
337 -
 338
338 -
 339
339 -
 340
340 -
 341
341 -
 342
342 -
 343
343 -
 344
344 -
 345
345 -
 346
346 -
 347
347 -
 348
348 -
 349
349 -
 350
350 -
 351
351 -
 352
352 -
 353
353 -
 354
354 -
 355
355 -
 356
356 -
 357
357 -
 358
358 -
 359
359 -
 360
360 -
 361
361 -
 362
362 -
 363
363 -
 364
364 -
 365
365 -
 366
366 -
 367
367 -
 368
368 -
 369
369 -
 370
370 -
 371
371 -
 372
372 -
 373
373 -
 374
374 -
 375
375 -
 376
376 -
 377
377 -
 378
378 -
 379
379 -
 380
380 -
 381
381 -
 382
382 -
 383
383 -
 384
384 -
 385
385 -
 386
386 -
 387
387 -
 388
388 -
 389
389 -
 390
390 -
 391
391 -
 392
392 -
 393
393 -
 394
394 -
 395
395 -
 396
396 -
 397
397 -
 398
398 -
 399
399 -
 400
400 -
 401
401 -
 402
402 -
 403
403 -
 404
404 -
 405
405 -
 406
406 -
 407
407 -
 408
408 -
 409
409 -
 410
410 -
 411
411 -
 412
412 -
 413
413 -
 414
414 -
 415
415 -
 416
416 -
 417
417 -
 418
418 -
 419
419 -
 420
420 -
 421
421 -
 422
422 -
 423
423 -
 424
424 -
 425
425 -
 426
426 -
 427
427 -
 428
428 -
 429
429 -
 430
430 -
 431
431 -
 432
432 -
 433
433 -
 434
434 -
 435
435 -
 436
436 -
 437
437 -
 438
438 -
 439
439 -
 440
440
 |
 |

113
Overview Operating & Financial Review Corporate Governance Financial Statements Shareholder Information
officials. This process enabled us to form a view of
the credit standing and the level of exposure that
the counterparties have to peripheral eurozone
sovereigns and banks. The majority of these
counterparties are located in France, Germany and
the Netherlands, where the exposures are disclosed
in aggregate below. Vulnerable counterparties were
identified, subject to enhanced monitoring and our
exposure was managed in a way similar to the
monitoring and management of direct exposures to
the peripheral eurozone countries.
The overall quality of the portfolio was strong
with most in-country and cross-border limits
extended to countries with high-grade internal credit
risk ratings. We regularly update our assessment of
higher risk countries and adjust our risk appetite
accordingly.
Exposures to countries in the eurozone
(Unaudited)
2011 was a turbulent year for the global markets,
dominated by the continuing eurozone debt crisis that
started with the global financial crisis in 2007 and,
by 2011, had developed into a severe sovereign debt
crisis. The measures taken by governments during
that period to avoid a financial collapse resulted in
higher debt levels, large fiscal deficits and, in certain
cases, social and political disruption. During 2011, a
number of eurozone countries came under severe
financial pressure and their ability to raise, refinance
and service their debt was put into question by
markets, as demonstrated by the record high spreads
during most of the year. Greece, Ireland and Portugal
were forced to seek support packages from the
European Central Bank (‘ECB’) and the International
Monetary Fund (‘IMF’) under strict conditions, while
fear of contagion to other eurozone countries forced
governments to reduce debt levels through austerity
measures that, at least in the short term, were seen
as the cause of slow growth for some countries and
stagnation in others.
Despite a number of high profile summits and
meetings the EU was unable to agree and implement
a strong coherent policy response to the crisis,
prompting fear of default or the exit from the euro of
one or more members. Under pressure during most of
2011, EU members showed an increasing willingness
to agree a structured common approach, but they also
demonstrated divergent opinions on the way forward
and on the measures to be taken. This resulted in the
three major rating agencies either downgrading, or
putting on the watch list for possible downgrade, a
number of sovereigns which intensified the pressure,
even on the stronger eurozone countries.
The ongoing sovereign debt crisis, slow
economic growth, dearth of market financing for
banks and private sector deleveraging severely
affected the eurozone financial system, increasing
the possibility of further banking stress in the region.
The banking sector within the peripheral eurozone
countries was particularly under threat as the credit
risk of domestic and cross-border exposures
increased significantly. This prompted calls from the
European Banking Authority (‘EBA’) and the IMF
for funding and liquidity support and/or the
recapitalisation of certain European banks.
The ratings downgrade of a number of eurozone
countries by major rating agencies in 2011 and
January 2012 was generally anticipated and was, in
most cases, not as large as feared, with the exception
of Portugal which is now rated below investment
grade. The downgrades are likely to have
implications for the ratings of European banks and
government guaranteed securities, as evidenced by
the downgrade of the European Financial Stability
Fund (‘EFSF’).
We continue to closely monitor events and have
stress-tested our capital position for potential
scenarios.
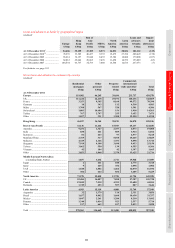
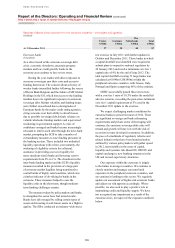
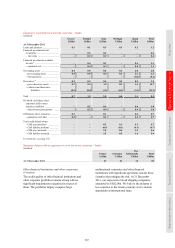
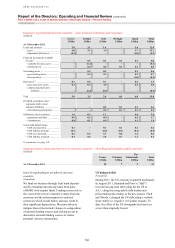
The tables below summarise our exposures to
selected eurozone countries, including:
• governments and central banks of selected
eurozone countries along with near/quasi
government agencies;
• banks; and
• other financial institutions and other corporates.
Exposures to banks, other financial institutions
and other corporates are based on the country of
domicile of the counterparty.
The following analysis of our exposures to
selected European countries is made voluntarily to
reflect developments in best practice disclosure.
Whilst certain analysis is subject to audit and
incorporated into the Group’s risk management
disclosure, it is not required for the purposes of
compliance with IFRSs.
Basis of preparation
(Audited)
The countries presented were selected as they
exhibited levels of market volatility during 2011
which exceeded other eurozone countries and
demonstrated fiscal or political uncertainty. Certain
of these countries also have high sovereign debt to
GDP ratios and a short to medium-term maturity
concentration of those liabilities.
