HSBC 2011 Annual Report Download - page 73
Download and view the complete annual report
Please find page 73 of the 2011 HSBC annual report below. You can navigate through the pages in the report by either clicking on the pages listed below, or by using the keyword search tool below to find specific information within the annual report.-
 1
1 -
2
-
3
-
4
-
5
-
6
-
7
-
8
-
9
-
10
-
11
-
12
-
13
-
14
-
15
-
16
-
17
-
18
-
19
-
20
-
21
-
22
-
23
-
24
-
25
-
26
-
27
-
28
-
29
-
30
-
31
-
32
-
33
-
34
-
35
-
36
-
37
-
38
-
39
-
40
-
41
-
42
-
43
-
44
-
45
-
46
-
47
-
48
-
49
-
50
-
51
-
52
-
53
-
54
-
55
-
56
-
57
-
58
-
59
-
60
-
61
-
62
-
 63
63 -
 64
64 -
 65
65 -
 66
66 -
 67
67 -
 68
68 -
 69
69 -
 70
70 -
 71
71 -
 72
72 -
 73
73 -
 74
74 -
 75
75 -
 76
76 -
 77
77 -
 78
78 -
 79
79 -
 80
80 -
 81
81 -
 82
82 -
 83
83 -
84
-
85
-
86
-
87
-
88
-
89
-
90
-
91
-
92
-
93
-
94
-
95
-
96
-
97
-
98
-
99
-
100
-
101
-
102
-
103
-
104
-
105
-
106
-
107
-
108
-
109
-
110
-
111
-
112
-
113
-
114
-
115
-
116
-
117
-
118
-
119
-
120
-
121
-
122
-
123
-
124
-
125
-
126
-
127
-
128
-
129
-
130
-
131
-
132
-
133
-
134
-
135
-
136
-
137
-
138
-
139
-
140
-
141
-
142
-
143
-
144
-
145
-
146
-
147
-
148
-
149
-
150
-
151
-
152
-
153
-
154
-
155
-
156
-
157
-
158
-
159
-
160
-
161
-
162
-
163
-
164
-
165
-
166
-
167
-
168
-
169
-
170
-
171
-
172
-
173
-
174
-
175
-
176
-
177
-
178
-
179
-
180
-
181
-
182
-
183
-
184
-
185
-
186
-
187
-
188
-
189
-
190
-
191
-
192
-
193
-
194
-
195
-
196
-
197
-
198
-
199
-
200
-
201
-
202
-
203
-
204
-
205
-
206
-
207
-
208
-
209
-
210
-
211
-
212
-
213
-
214
-
215
-
216
-
217
-
218
-
219
-
220
-
221
-
222
-
223
-
224
-
225
-
226
-
227
-
228
-
229
-
230
-
231
-
232
-
233
-
234
-
235
-
236
-
237
-
238
-
239
-
240
-
241
-
242
-
243
-
244
-
245
-
246
-
247
-
248
-
249
-
250
-
251
-
252
-
253
-
254
-
255
-
256
-
257
-
258
-
259
-
260
-
261
-
262
-
263
-
264
-
265
-
266
-
267
-
268
-
269
-
270
-
271
-
272
-
273
-
274
-
275
-
276
-
277
-
278
-
279
-
280
-
281
-
282
-
283
-
284
-
285
-
286
-
287
-
288
-
289
-
290
-
291
-
292
-
293
-
294
-
295
-
296
-
297
-
298
-
299
-
300
-
301
-
302
-
303
-
304
-
305
-
306
-
307
-
308
-
309
-
310
-
311
-
312
-
313
-
314
-
315
-
316
-
317
-
318
-
319
-
320
-
321
-
322
-
323
-
324
-
325
-
326
-
327
-
328
-
329
-
330
-
331
-
332
-
333
-
334
-
335
-
336
-
337
-
338
-
339
-
340
-
341
-
342
-
343
-
344
-
345
-
346
-
347
-
348
-
349
-
350
-
351
-
352
-
353
-
354
-
355
-
356
-
357
-
358
-
359
-
360
-
361
-
362
-
363
-
364
-
365
-
366
-
367
-
368
-
369
-
370
-
371
-
372
-
373
-
374
-
375
-
376
-
377
-
378
-
379
-
380
-
381
-
382
-
383
-
384
-
385
-
386
-
387
-
388
-
389
-
390
-
391
-
392
-
393
-
394
-
395
-
396
-
397
-
398
-
399
-
400
-
401
-
402
-
403
-
404
-
405
-
406
-
407
-
408
-
409
-
410
-
411
-
412
-
413
-
414
-
415
-
416
-
417
-
418
-
419
-
420
-
421
-
422
-
423
-
424
-
425
-
426
-
427
-
428
-
429
-
430
-
431
-
432
-
433
-
434
-
435
-
436
-
437
-
438
-
439
-
440
 |
 |

71
Overview Operating & Financial Review Corporate Governance Financial Statements Shareholder Information
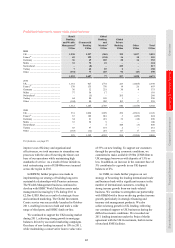
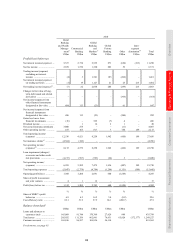
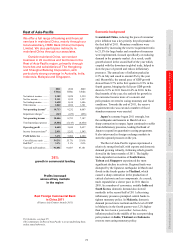
Rest of Asia-Pacific
We offer a full range of banking and financial
services in mainland China, mainly through our
local subsidiary, HSBC Bank (China) Company
Limited. We also participate indirectly in
mainland China through our associates.
Outside mainland China, we conduct
business in 22 countries and territories in the
Rest of Asia-Pacific region, primarily through
branches and subsidiaries of The Hongkong
and Shanghai Banking Corporation, with
particularly strong coverage in Australia, India,
Indonesia, Malaysia and Singapore.
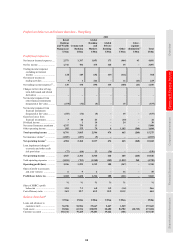
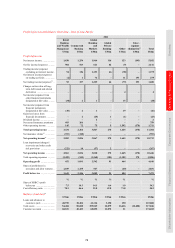
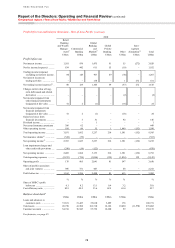
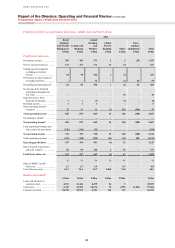
2011 2010 2009
US$m US$m US$m
Net interest income .......... 5,102 3,828 3,539
Net fee income ................. 2,111 1,932 1,557
Net trading income .......... 1,658 1,618 1,606
Other income ................... 1,842 1,854 1,301
Net operating income52 .. 10,713 9,232 8,003
Impairment charges53 ....... (267) (439) (896)
Net operating income .... 10,446 8,793 7,107
Total operating expenses . (5,806) (5,143) (4,450)
Operating profit ............. 4,640 3,650 2,657
Income from associates54 . 2,831 2,252 1,543
Profit before tax ............. 7,471 5,902 4,200
Cost efficiency ratio ........ 54.2% 55.7% 55.6%
RoRWA55 ......................... 3.1% 3.1% 2.4%
Year-end staff numbers ... 91,051 91,607 87,141
24%
growth in commercial lending
Profits increased
across all key markets
in the region
Best Foreign Commercial Bank
in China 2011
(Finance Asia Country Awards 2011)
For footnotes, see page 95.
The commentary on Rest of Asia-Pacific is on an underlying basis
unless stated otherwise.
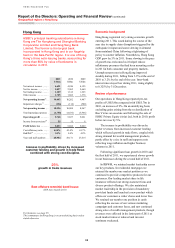
Economic background
In mainland China, reducing the pace of consumer
price inflation was a key priority for policymakers in
the first half of 2011. Monetary conditions were
tightened by increasing the reserve requirement ratio
to 21.5% for large banks and a number of measures
were implemented, focused specifically on reducing
demand in the property market. As a result, credit
growth slowed in the second half of the year which,
coupled with the downturn in global trade, helped to
slow the pace of growth and reduce inflationary
pressures. The annual rate of inflation peaked at
6.5% in July and eased to around 4% by the year
end. Meanwhile, the annual pace of GDP growth
slowed from 9.7% in the first quarter to 8.9% in the
fourth quarter, bringing the full year GDP growth
down to 9.2% in 2011 from 10.4% in 2010. In the
final months of the year, the outlook for growth in
the eurozone became more of a concern and
policymakers reverted to easing monetary and fiscal
conditions. Towards the end of 2011, the reserve
requirement ratio was cut and a number of fiscal
stimulus measures were enacted.
Japan’s economy began 2011 strongly, but
the earthquake and tsunami in March led to a
sharp contraction in output. Japan continued to suffer
from deflationary pressures, leading the Bank of
Japan to expand its quantitative easing programme.
It also intervened in foreign exchange markets to
stem the upward pressure on the yen.
The Rest of Asia-Pacific region experienced a
relatively strong first half, with exports and domestic
demand growing robustly, following which growth
slowed in the latter months of 2011. The highly
trade-dependent economies of South Korea,
Taiwan and Singapore experienced the most
significant decline in activity. Regional trade was
disrupted by the Japanese earthquake in March and
floods in the fourth quarter in Thailand, which
caused a sharp contraction in the production of
critical electronic and car components. As a result,
trade expanded at a slower pace in 2011 than in
2010. In a number of economies, notably India and
South Korea, domestic demand also slowed
markedly in the second half of 2011 after rising
inflationary pressures prompted central banks to
tighten monetary policy. In Malaysia, domestic
demand proved more resilient and the level of GDP
in Malaysia in the fourth quarter was 5.2% higher
than the level seen a year earlier. Across Asia,
inflation peaked in the middle of the year providing
policymakers in India, Thailand and Indonesia
room to start easing monetary policy.