HSBC 2011 Annual Report Download - page 35
Download and view the complete annual report
Please find page 35 of the 2011 HSBC annual report below. You can navigate through the pages in the report by either clicking on the pages listed below, or by using the keyword search tool below to find specific information within the annual report.-
 1
1 -
2
-
3
-
4
-
5
-
6
-
7
-
8
-
9
-
10
-
11
-
12
-
13
-
14
-
15
-
16
-
17
-
18
-
19
-
20
-
21
-
22
-
23
-
24
-
 25
25 -
 26
26 -
 27
27 -
 28
28 -
 29
29 -
 30
30 -
 31
31 -
 32
32 -
 33
33 -
 34
34 -
 35
35 -
 36
36 -
 37
37 -
 38
38 -
 39
39 -
 40
40 -
 41
41 -
 42
42 -
 43
43 -
 44
44 -
 45
45 -
46
-
47
-
48
-
49
-
50
-
51
-
52
-
53
-
54
-
55
-
56
-
57
-
58
-
59
-
60
-
61
-
62
-
63
-
64
-
65
-
66
-
67
-
68
-
69
-
70
-
71
-
72
-
73
-
74
-
75
-
76
-
77
-
78
-
79
-
80
-
81
-
82
-
83
-
84
-
85
-
86
-
87
-
88
-
89
-
90
-
91
-
92
-
93
-
94
-
95
-
96
-
97
-
98
-
99
-
100
-
101
-
102
-
103
-
104
-
105
-
106
-
107
-
108
-
109
-
110
-
111
-
112
-
113
-
114
-
115
-
116
-
117
-
118
-
119
-
120
-
121
-
122
-
123
-
124
-
125
-
126
-
127
-
128
-
129
-
130
-
131
-
132
-
133
-
134
-
135
-
136
-
137
-
138
-
139
-
140
-
141
-
142
-
143
-
144
-
145
-
146
-
147
-
148
-
149
-
150
-
151
-
152
-
153
-
154
-
155
-
156
-
157
-
158
-
159
-
160
-
161
-
162
-
163
-
164
-
165
-
166
-
167
-
168
-
169
-
170
-
171
-
172
-
173
-
174
-
175
-
176
-
177
-
178
-
179
-
180
-
181
-
182
-
183
-
184
-
185
-
186
-
187
-
188
-
189
-
190
-
191
-
192
-
193
-
194
-
195
-
196
-
197
-
198
-
199
-
200
-
201
-
202
-
203
-
204
-
205
-
206
-
207
-
208
-
209
-
210
-
211
-
212
-
213
-
214
-
215
-
216
-
217
-
218
-
219
-
220
-
221
-
222
-
223
-
224
-
225
-
226
-
227
-
228
-
229
-
230
-
231
-
232
-
233
-
234
-
235
-
236
-
237
-
238
-
239
-
240
-
241
-
242
-
243
-
244
-
245
-
246
-
247
-
248
-
249
-
250
-
251
-
252
-
253
-
254
-
255
-
256
-
257
-
258
-
259
-
260
-
261
-
262
-
263
-
264
-
265
-
266
-
267
-
268
-
269
-
270
-
271
-
272
-
273
-
274
-
275
-
276
-
277
-
278
-
279
-
280
-
281
-
282
-
283
-
284
-
285
-
286
-
287
-
288
-
289
-
290
-
291
-
292
-
293
-
294
-
295
-
296
-
297
-
298
-
299
-
300
-
301
-
302
-
303
-
304
-
305
-
306
-
307
-
308
-
309
-
310
-
311
-
312
-
313
-
314
-
315
-
316
-
317
-
318
-
319
-
320
-
321
-
322
-
323
-
324
-
325
-
326
-
327
-
328
-
329
-
330
-
331
-
332
-
333
-
334
-
335
-
336
-
337
-
338
-
339
-
340
-
341
-
342
-
343
-
344
-
345
-
346
-
347
-
348
-
349
-
350
-
351
-
352
-
353
-
354
-
355
-
356
-
357
-
358
-
359
-
360
-
361
-
362
-
363
-
364
-
365
-
366
-
367
-
368
-
369
-
370
-
371
-
372
-
373
-
374
-
375
-
376
-
377
-
378
-
379
-
380
-
381
-
382
-
383
-
384
-
385
-
386
-
387
-
388
-
389
-
390
-
391
-
392
-
393
-
394
-
395
-
396
-
397
-
398
-
399
-
400
-
401
-
402
-
403
-
404
-
405
-
406
-
407
-
408
-
409
-
410
-
411
-
412
-
413
-
414
-
415
-
416
-
417
-
418
-
419
-
420
-
421
-
422
-
423
-
424
-
425
-
426
-
427
-
428
-
429
-
430
-
431
-
432
-
433
-
434
-
435
-
436
-
437
-
438
-
439
-
440
 |
 |

33
Overview Operating & Financial Review Corporate Governance Financial Statements Shareholder Information
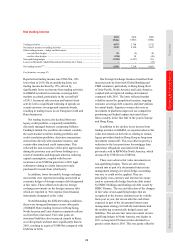
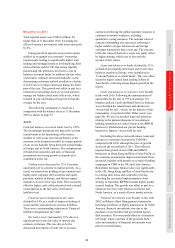
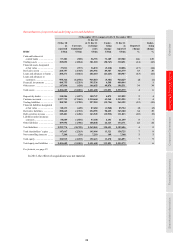
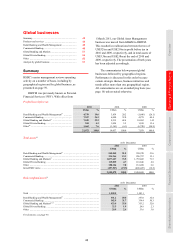
Movement in 2011
Total reported assets were US$2.6 trillion, 4%
higher than at 31 December 2010. Excluding the
effect of currency movements, total assets increased
by 6%.
Strong growth in deposits across most regions
enabled us to support our customers’ borrowing
requirements, leading to significantly higher term
lending and mortgage balances in Hong Kong, Rest
of Asia-Pacific and the UK. Our strong liquidity
position and risk preference also led to a rise in
balances at central banks. In addition, the fair value
of derivative contracts increased markedly, as the
deteriorating economic outlook resulted in a decline
in yield curves in major currencies during the latter
part of the year. This growth was offset in part by a
reduction in net trading assets as we took action to
manage our balance sheet more effectively, which
resulted in year-end balances being lower than the
average for the year.
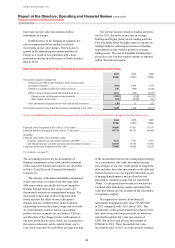
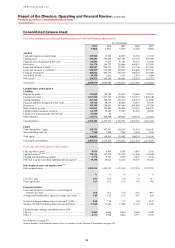
The following commentary is based on a
comparison with the balance sheet at 31 December
2010 as shown on page 35.
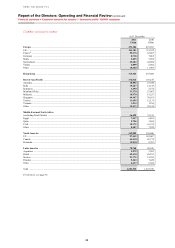
Assets
Cash and balances at central banks rose by 129%.
The increasingly prominent role played by western
central banks in the functioning of the money
markets as well as our own risk preference as the
eurozone crisis deepened resulted in a larger portion
of our excess liquidity being held with central banks
in Europe and in North America. The redeployment
of funds from maturities and sales of financial
investments and strong growth in deposits also
contributed to the rise.
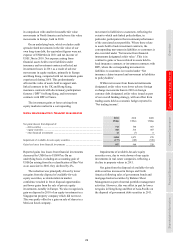
Trading assets decreased by 13%. Economic
uncertainty led to a decline in market activity. As a
result, we reduced our holdings of government and
highly-rated corporate debt securities and equity
positions, notably in Europe, and did not replace
maturities in our reverse repo book. This was partly
offset by higher cash collateral posted with external
counterparties as the fair value of derivative
liabilities rose.
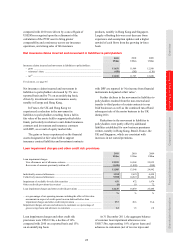
Financial assets designated at fair value
declined by 14% as a result of improved netting of
assets and the associated non-recourse liabilities.
There was a corresponding reduction in ‘Financial
liabilities designated at fair value’.
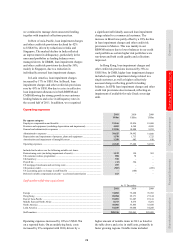
Derivative assets increased by 35%, due to a
significant rise in the fair value of interest rate
contracts in Europe. This was driven by the
downward movements of yield curves in major
currencies following the global monetary response to
continued economic weakness, including
quantitative easing measures. The notional value of
contracts outstanding also increased, reflecting a
higher number of open interest rate and foreign
exchange transactions than a year ago. The increase
in the fair value of derivative assets was partly offset
by higher netting, which rose in line with the
increase in fair values.
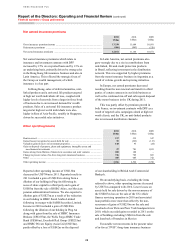
Loans and advances to banks declined by 11%,
as funds from maturing term loans and reverse repo
balances, notably in Europe, were redeployed to
‘Cash and balances at central banks’. This was offset
in part by higher central bank lending in Rest of
Asia-Pacific, reflecting strong deposit growth in the
region.
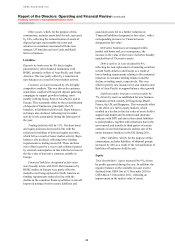
Loans and advances to customers were broadly
in line with 2010. Following the announcement of
agreements for the sale of 195 non-strategic US
branches and our Cards and Retail Services business,
we reclassified the related loans and advances to
‘Assets held for sale’, which, for the purpose of this
commentary, is reported within ‘Other assets’ (see
page 86). We also reclassified loans and advances
relating to the planned disposals of non-strategic
banking operations in Central America, the RBWM
business in Thailand and our private banking
business in Japan to ‘Assets held for sale’.
Excluding the above reclassifications, loans and
advances to customers increased by US$30bn
compared with 2010, although the pace of growth
slowed in the second half of 2011. This reflected
targeted loan growth in our CMB and GB&M
businesses in Hong Kong and Rest of Asia-Pacific as
the economic environment improved and trade flows
increased, together with growth as a result of lending
campaigns in CMB in the UK and Latin America.
Residential mortgage balances also rose significantly
in the UK, Hong Kong and Rest of Asia-Pacific due
to a strong sales focus and competitive pricing,
reflecting the successful implementation of our
strategy to reposition RBWM towards higher quality
secured lending. This growth was offset in part by a
reduction in reverse repo balances in Europe and
North America, as a result of lower market activity.
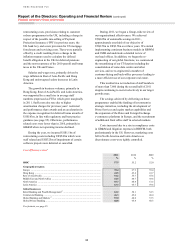
Financial investments were broadly in line with
2010, as Balance Sheet Management continued to
hold large portfolios of highly liquid assets. In North
America, financial investments rose due to the
purchases of government and government agency
debt securities. This was partly offset by a reduction
in Europe, where a portion of the proceeds from
sales and maturities of financial investments were
placed at central banks.