HSBC 2011 Annual Report Download - page 30
Download and view the complete annual report
Please find page 30 of the 2011 HSBC annual report below. You can navigate through the pages in the report by either clicking on the pages listed below, or by using the keyword search tool below to find specific information within the annual report.-
 1
1 -
 2
2 -
 3
3 -
 4
4 -
 5
5 -
 6
6 -
 7
7 -
 8
8 -
 9
9 -
 10
10 -
 11
11 -
 12
12 -
 13
13 -
 14
14 -
 15
15 -
 16
16 -
 17
17 -
 18
18 -
 19
19 -
 20
20 -
 21
21 -
 22
22 -
 23
23 -
 24
24 -
 25
25 -
 26
26 -
 27
27 -
 28
28 -
 29
29 -
 30
30 -
 31
31 -
 32
32 -
 33
33 -
 34
34 -
 35
35 -
 36
36 -
 37
37 -
 38
38 -
 39
39 -
 40
40 -
 41
41 -
 42
42 -
 43
43 -
 44
44 -
 45
45 -
 46
46 -
 47
47 -
 48
48 -
 49
49 -
 50
50 -
 51
51 -
 52
52 -
 53
53 -
 54
54 -
 55
55 -
 56
56 -
 57
57 -
 58
58 -
 59
59 -
 60
60 -
 61
61 -
 62
62 -
 63
63 -
 64
64 -
 65
65 -
 66
66 -
 67
67 -
 68
68 -
 69
69 -
 70
70 -
 71
71 -
 72
72 -
 73
73 -
 74
74 -
 75
75 -
 76
76 -
 77
77 -
 78
78 -
 79
79 -
 80
80 -
 81
81 -
 82
82 -
 83
83 -
 84
84 -
 85
85 -
 86
86 -
 87
87 -
 88
88 -
 89
89 -
 90
90 -
 91
91 -
 92
92 -
 93
93 -
 94
94 -
 95
95 -
 96
96 -
 97
97 -
 98
98 -
 99
99 -
 100
100 -
 101
101 -
 102
102 -
 103
103 -
 104
104 -
 105
105 -
 106
106 -
 107
107 -
 108
108 -
 109
109 -
 110
110 -
 111
111 -
 112
112 -
 113
113 -
 114
114 -
 115
115 -
 116
116 -
 117
117 -
 118
118 -
 119
119 -
 120
120 -
 121
121 -
 122
122 -
 123
123 -
 124
124 -
 125
125 -
 126
126 -
 127
127 -
 128
128 -
 129
129 -
 130
130 -
 131
131 -
 132
132 -
 133
133 -
 134
134 -
 135
135 -
 136
136 -
 137
137 -
 138
138 -
 139
139 -
 140
140 -
 141
141 -
 142
142 -
 143
143 -
 144
144 -
 145
145 -
 146
146 -
 147
147 -
 148
148 -
 149
149 -
 150
150 -
 151
151 -
 152
152 -
 153
153 -
 154
154 -
 155
155 -
 156
156 -
 157
157 -
 158
158 -
 159
159 -
 160
160 -
 161
161 -
 162
162 -
 163
163 -
 164
164 -
 165
165 -
 166
166 -
 167
167 -
 168
168 -
 169
169 -
 170
170 -
 171
171 -
 172
172 -
 173
173 -
 174
174 -
 175
175 -
 176
176 -
 177
177 -
 178
178 -
 179
179 -
 180
180 -
 181
181 -
 182
182 -
 183
183 -
 184
184 -
 185
185 -
 186
186 -
 187
187 -
 188
188 -
 189
189 -
 190
190 -
 191
191 -
 192
192 -
 193
193 -
 194
194 -
 195
195 -
 196
196 -
 197
197 -
 198
198 -
 199
199 -
 200
200 -
 201
201 -
 202
202 -
 203
203 -
 204
204 -
 205
205 -
 206
206 -
 207
207 -
 208
208 -
 209
209 -
 210
210 -
 211
211 -
 212
212 -
 213
213 -
 214
214 -
 215
215 -
 216
216 -
 217
217 -
 218
218 -
 219
219 -
 220
220 -
 221
221 -
 222
222 -
 223
223 -
 224
224 -
 225
225 -
 226
226 -
 227
227 -
 228
228 -
 229
229 -
 230
230 -
 231
231 -
 232
232 -
 233
233 -
 234
234 -
 235
235 -
 236
236 -
 237
237 -
 238
238 -
 239
239 -
 240
240 -
 241
241 -
 242
242 -
 243
243 -
 244
244 -
 245
245 -
 246
246 -
 247
247 -
 248
248 -
 249
249 -
 250
250 -
 251
251 -
 252
252 -
 253
253 -
 254
254 -
 255
255 -
 256
256 -
 257
257 -
 258
258 -
 259
259 -
 260
260 -
 261
261 -
 262
262 -
 263
263 -
 264
264 -
 265
265 -
 266
266 -
 267
267 -
 268
268 -
 269
269 -
 270
270 -
 271
271 -
 272
272 -
 273
273 -
 274
274 -
 275
275 -
 276
276 -
 277
277 -
 278
278 -
 279
279 -
 280
280 -
 281
281 -
 282
282 -
 283
283 -
 284
284 -
 285
285 -
 286
286 -
 287
287 -
 288
288 -
 289
289 -
 290
290 -
 291
291 -
 292
292 -
 293
293 -
 294
294 -
 295
295 -
 296
296 -
 297
297 -
 298
298 -
 299
299 -
 300
300 -
 301
301 -
 302
302 -
 303
303 -
 304
304 -
 305
305 -
 306
306 -
 307
307 -
 308
308 -
 309
309 -
 310
310 -
 311
311 -
 312
312 -
 313
313 -
 314
314 -
 315
315 -
 316
316 -
 317
317 -
 318
318 -
 319
319 -
 320
320 -
 321
321 -
 322
322 -
 323
323 -
 324
324 -
 325
325 -
 326
326 -
 327
327 -
 328
328 -
 329
329 -
 330
330 -
 331
331 -
 332
332 -
 333
333 -
 334
334 -
 335
335 -
 336
336 -
 337
337 -
 338
338 -
 339
339 -
 340
340 -
 341
341 -
 342
342 -
 343
343 -
 344
344 -
 345
345 -
 346
346 -
 347
347 -
 348
348 -
 349
349 -
 350
350 -
 351
351 -
 352
352 -
 353
353 -
 354
354 -
 355
355 -
 356
356 -
 357
357 -
 358
358 -
 359
359 -
 360
360 -
 361
361 -
 362
362 -
 363
363 -
 364
364 -
 365
365 -
 366
366 -
 367
367 -
 368
368 -
 369
369 -
 370
370 -
 371
371 -
 372
372 -
 373
373 -
 374
374 -
 375
375 -
 376
376 -
 377
377 -
 378
378 -
 379
379 -
 380
380 -
 381
381 -
 382
382 -
 383
383 -
 384
384 -
 385
385 -
 386
386 -
 387
387 -
 388
388 -
 389
389 -
 390
390 -
 391
391 -
 392
392 -
 393
393 -
 394
394 -
 395
395 -
 396
396 -
 397
397 -
 398
398 -
 399
399 -
 400
400 -
 401
401 -
 402
402 -
 403
403 -
 404
404 -
 405
405 -
 406
406 -
 407
407 -
 408
408 -
 409
409 -
 410
410 -
 411
411 -
 412
412 -
 413
413 -
 414
414 -
 415
415 -
 416
416 -
 417
417 -
 418
418 -
 419
419 -
 420
420 -
 421
421 -
 422
422 -
 423
423 -
 424
424 -
 425
425 -
 426
426 -
 427
427 -
 428
428 -
 429
429 -
 430
430 -
 431
431 -
 432
432 -
 433
433 -
 434
434 -
 435
435 -
 436
436 -
 437
437 -
 438
438 -
 439
439 -
 440
440
 |
 |

HSBC HOLDINGS PLC
Report of the Directors: Operating and Financial Review (continued)
Financial summary > Group performance
28
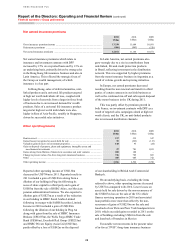
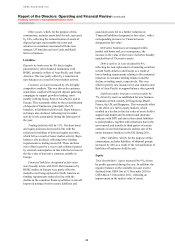
settlement accounts) compared with 2.2% at
31 December 2010.
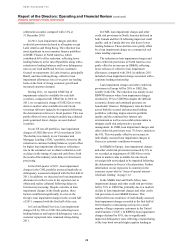
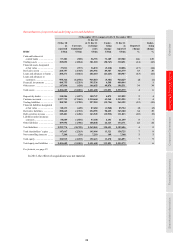
In 2011, loan impairment charges and other
credit risk provisions declined in all regions except
Latin America and Hong Kong. The reduction was
most significant in our consumer finance portfolios
in HSBC Finance in North America, which
contributed 66% of the reduction, reflecting lower
lending balances in the run-off portfolio along with a
reduction in lending balances and lower delinquency
rates as our Card and Retail Services customers
focused on repayments. In Latin America, principally
Brazil, and also in Hong Kong, collective loan
impairment allowances rose as we grew our lending
book on the back of strong economic growth and
increased customer demand.
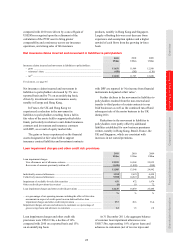
During 2011, we reported US$631m of
impairments related to available-for-sale debt
securities, compared with US$472m in 2010. In
2011, we recognised a charge of US$212m to write
down to market value available-for-sale Greek
sovereign debt now judged to be impaired following
the deterioration in Greece’s fiscal position. This was
partly offset as losses arising in underlying collateral
pools generated lower charges on asset-backed
securities.
In our US run-off portfolios, loan impairment
charges of US$5.0bn were 14% lower than in 2010.
The decline was mainly in our Consumer and
Mortgage Lending (‘CML’) portfolio, driven by the
reduction in customer lending balances, in part offset
by higher loan impairment allowances reflecting a
rise in the estimated cost to obtain collateral as well
as delays in the timing of expected cash flows, both
the result of the industry-wide delays in foreclosure
processing.
In the third quarter of 2011, loan impairment
charges in the CML portfolio increased markedly as
delinquency worsened compared with the first half of
2011. In addition, we increased our loan impairment
allowances to reflect a rise in the expected cost to
obtain and realise collateral following delays in
foreclosure processing. Despite a decline in loan
impairment charges in the fourth quarter, these
factors contributed significantly to a rise in the
Group’s loan impairment charges in the second half
of 2011 compared with the first half of the year.
In Card and Retail Services, loan impairment
charges fell by 26% to US$1.6bn reflecting lower
lending balances and improved delinquency rates as
customer repayment rates remained strong during
2011.
In CMB, loan impairment charges and other
credit risk provisions in North America declined in
both Canada and the US reflecting improved credit
quality, and in Canada this was also due to lower
lending balances. These declines were partly offset
by a loan impairment charge on a commercial real
estate lending exposure.
The reduction in loan impairment charges and
other credit risk provisions in North America was
partly offset by an increase in GB&M, reflecting
lower releases of collective loan impairment
allowances compared with 2010. In addition, 2011
included a loan impairment charge associated with a
corporate lending relationship.
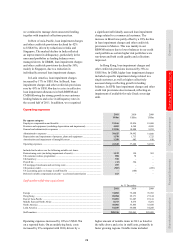
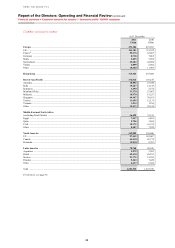
Loan impairment charges and other credit risk
provisions in Europe fell by 20% to US$2.5bn,
notably in the UK. The reduction was mainly in our
RBWM business where loan impairment charges
declined by 53% to US$596m despite the difficult
economic climate and continued pressures on
households’ finances. Delinquency rates declined
across both the secured and unsecured lending
portfolios, reflecting improvement in portfolio
quality and the continued low interest rate
environment as well as successful actions taken to
mitigate credit risk and proactive account
management. In CMB, loan impairment charges and
other credit risk provisions were 7% lower, mainly in
the UK. This was partly offset by an increase in
individually assessed loan impairment charges in
Greece as economic conditions worsened.
In GB&M in Europe, loan impairment charges
and other credit risk provisions increased by 8% as
we recorded an impairment of US$145m to write
down to market value available-for-sale Greek
sovereign debt now judged to be impaired following
the deterioration in Greece’s fiscal position. Further
information on our exposures to countries in the
eurozone is provided in ‘Areas of special interest –
wholesale lending’ on page 112.
In the Middle East and North Africa, loan
impairment charges and other credit risk provisions
fell by 53% to US$293m, primarily due to a marked
decline in loan impairment charges and other credit
risk provisions in our GB&M business. This
reflected the non-recurrence of individually assessed
loan impairment charges recorded in the first half of
2010 related to restructuring activity for a small
number of large corporate customers in the United
Arab Emirates (‘UAE’). In RBWM, loan impairment
charges declined by 45%, due to significantly
improved delinquency rates reflecting a repositioning
of the loan book towards higher quality lending as
