HSBC 2011 Annual Report Download - page 119
Download and view the complete annual report
Please find page 119 of the 2011 HSBC annual report below. You can navigate through the pages in the report by either clicking on the pages listed below, or by using the keyword search tool below to find specific information within the annual report.-
 1
1 -
2
-
3
-
4
-
5
-
6
-
7
-
8
-
9
-
10
-
11
-
12
-
13
-
14
-
15
-
16
-
17
-
18
-
19
-
20
-
21
-
22
-
23
-
24
-
25
-
26
-
27
-
28
-
29
-
30
-
31
-
32
-
33
-
34
-
35
-
36
-
37
-
38
-
39
-
40
-
41
-
42
-
43
-
44
-
45
-
46
-
47
-
48
-
49
-
50
-
51
-
52
-
53
-
54
-
55
-
56
-
57
-
58
-
59
-
60
-
61
-
62
-
63
-
64
-
65
-
66
-
67
-
68
-
69
-
70
-
71
-
72
-
73
-
74
-
75
-
76
-
77
-
78
-
79
-
80
-
81
-
82
-
83
-
84
-
85
-
86
-
87
-
88
-
89
-
90
-
91
-
92
-
93
-
94
-
95
-
96
-
97
-
98
-
99
-
100
-
101
-
102
-
103
-
104
-
105
-
106
-
107
-
108
-
 109
109 -
 110
110 -
 111
111 -
 112
112 -
 113
113 -
 114
114 -
 115
115 -
 116
116 -
 117
117 -
 118
118 -
 119
119 -
 120
120 -
 121
121 -
 122
122 -
 123
123 -
 124
124 -
 125
125 -
 126
126 -
 127
127 -
 128
128 -
 129
129 -
130
-
131
-
132
-
133
-
134
-
135
-
136
-
137
-
138
-
139
-
140
-
141
-
142
-
143
-
144
-
145
-
146
-
147
-
148
-
149
-
150
-
151
-
152
-
153
-
154
-
155
-
156
-
157
-
158
-
159
-
160
-
161
-
162
-
163
-
164
-
165
-
166
-
167
-
168
-
169
-
170
-
171
-
172
-
173
-
174
-
175
-
176
-
177
-
178
-
179
-
180
-
181
-
182
-
183
-
184
-
185
-
186
-
187
-
188
-
189
-
190
-
191
-
192
-
193
-
194
-
195
-
196
-
197
-
198
-
199
-
200
-
201
-
202
-
203
-
204
-
205
-
206
-
207
-
208
-
209
-
210
-
211
-
212
-
213
-
214
-
215
-
216
-
217
-
218
-
219
-
220
-
221
-
222
-
223
-
224
-
225
-
226
-
227
-
228
-
229
-
230
-
231
-
232
-
233
-
234
-
235
-
236
-
237
-
238
-
239
-
240
-
241
-
242
-
243
-
244
-
245
-
246
-
247
-
248
-
249
-
250
-
251
-
252
-
253
-
254
-
255
-
256
-
257
-
258
-
259
-
260
-
261
-
262
-
263
-
264
-
265
-
266
-
267
-
268
-
269
-
270
-
271
-
272
-
273
-
274
-
275
-
276
-
277
-
278
-
279
-
280
-
281
-
282
-
283
-
284
-
285
-
286
-
287
-
288
-
289
-
290
-
291
-
292
-
293
-
294
-
295
-
296
-
297
-
298
-
299
-
300
-
301
-
302
-
303
-
304
-
305
-
306
-
307
-
308
-
309
-
310
-
311
-
312
-
313
-
314
-
315
-
316
-
317
-
318
-
319
-
320
-
321
-
322
-
323
-
324
-
325
-
326
-
327
-
328
-
329
-
330
-
331
-
332
-
333
-
334
-
335
-
336
-
337
-
338
-
339
-
340
-
341
-
342
-
343
-
344
-
345
-
346
-
347
-
348
-
349
-
350
-
351
-
352
-
353
-
354
-
355
-
356
-
357
-
358
-
359
-
360
-
361
-
362
-
363
-
364
-
365
-
366
-
367
-
368
-
369
-
370
-
371
-
372
-
373
-
374
-
375
-
376
-
377
-
378
-
379
-
380
-
381
-
382
-
383
-
384
-
385
-
386
-
387
-
388
-
389
-
390
-
391
-
392
-
393
-
394
-
395
-
396
-
397
-
398
-
399
-
400
-
401
-
402
-
403
-
404
-
405
-
406
-
407
-
408
-
409
-
410
-
411
-
412
-
413
-
414
-
415
-
416
-
417
-
418
-
419
-
420
-
421
-
422
-
423
-
424
-
425
-
426
-
427
-
428
-
429
-
430
-
431
-
432
-
433
-
434
-
435
-
436
-
437
-
438
-
439
-
440
 |
 |

117
Overview Operating & Financial Review Corporate Governance Financial Statements Shareholder Information
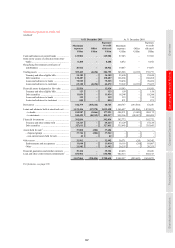
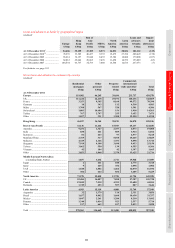
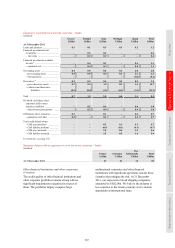
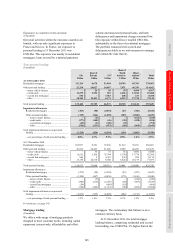
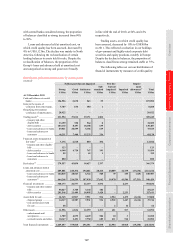
Exposures to peripheral eurozone countries – banks
(Audited)
Greece Ireland Italy Portugal Spain Total
US$bn US$bn US$bn US$bn US$bn US$bn
At 31 December 2011
Loans and advances ........................... 0.1 0.1 0.5 0.3 0.2 1.2
Financial investments held
to maturity ..................................... – 0.2 0.2 – – 0.4
– fair value .................................... – 0.2 0.2 – – 0.4
Financial investments available
for sale11 ......................................... – 0.4 0.3 – 0.4 1.1
– amortised cost ............................. – 0.4 0.3 – 0.4 1.1
Net trading assets ............................... 0.4 0.9 0.6 0.1 2.0 4.0
– gross trading assets ..................... 0.4 0.9 0.6 0.1 2.4 4.4
– short positions ............................ – – – – (0.4) (0.4)
Derivatives12 ...................................... 0.2 0.3 0.4 0.1 0.5 1.5
– gross derivative assets ................ 0.7 8.3 1.9 0.2 3.6 14.7
– collateral and derivative
liabilities ................................ (0.5) (8.0) (1.5) (0.1) (3.1) (13.2)
Total ................................................... 0.7 1.9 2.0 0.5 3.1 8.2
Of which, on-balance sheet
exposures held to meet
insurance liabilities ........................ – 0.2 0.4 – 0.4 1.0
– discretionary participatory ......... – 0.2 0.4 – 0.4 1.0
Off-balance sheet exposures .............. 0.2 – 0.1 – 0.4 0.7
– guarantees and other ................... 0.2 – 0.1 – 0.4 0.7
Total credit default swaps
– CDS asset positions .................... – – 0.5 0.1 0.1 0.7
– CDS liability positions ............... – – (0.5) (0.1) (0.1) (0.7)
– CDS asset notionals .................... – – 3.5 0.6 1.5 5.6
– CDS liability notionals ............... – – 3.5 0.5 1.4 5.4
For footnotes, see page 185.
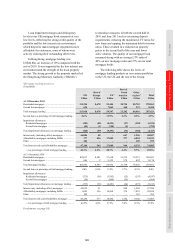
Summary balance sheet exposures to core eurozone countries – banks
(Audited)
France Germany
The
Netherlands Total
US$bn US$bn US$bn US$bn
At 31 December 2011 .............................................................................. 47 21 15 83
Other financial institutions and other corporates
(Unaudited)
The credit quality of other financial institutions and
other corporate portfolios remains strong with no
significant impairments recognised in respect of
them. The portfolios largely comprise large
multinational corporates and other financial
institutions with significant operations outside these
countries that mitigate the risk. At 31 December
2011, our exposure to Greek shipping companies
amounted to US$2.0bn. We believe the industry is
less sensitive to the Greek economy as it is mainly
dependent on international trade.