HSBC 2011 Annual Report Download - page 245
Download and view the complete annual report
Please find page 245 of the 2011 HSBC annual report below. You can navigate through the pages in the report by either clicking on the pages listed below, or by using the keyword search tool below to find specific information within the annual report.-
 1
1 -
2
-
3
-
4
-
5
-
6
-
7
-
8
-
9
-
10
-
11
-
12
-
13
-
14
-
15
-
16
-
17
-
18
-
19
-
20
-
21
-
22
-
23
-
24
-
25
-
26
-
27
-
28
-
29
-
30
-
31
-
32
-
33
-
34
-
35
-
36
-
37
-
38
-
39
-
40
-
41
-
42
-
43
-
44
-
45
-
46
-
47
-
48
-
49
-
50
-
51
-
52
-
53
-
54
-
55
-
56
-
57
-
58
-
59
-
60
-
61
-
62
-
63
-
64
-
65
-
66
-
67
-
68
-
69
-
70
-
71
-
72
-
73
-
74
-
75
-
76
-
77
-
78
-
79
-
80
-
81
-
82
-
83
-
84
-
85
-
86
-
87
-
88
-
89
-
90
-
91
-
92
-
93
-
94
-
95
-
96
-
97
-
98
-
99
-
100
-
101
-
102
-
103
-
104
-
105
-
106
-
107
-
108
-
109
-
110
-
111
-
112
-
113
-
114
-
115
-
116
-
117
-
118
-
119
-
120
-
121
-
122
-
123
-
124
-
125
-
126
-
127
-
128
-
129
-
130
-
131
-
132
-
133
-
134
-
135
-
136
-
137
-
138
-
139
-
140
-
141
-
142
-
143
-
144
-
145
-
146
-
147
-
148
-
149
-
150
-
151
-
152
-
153
-
154
-
155
-
156
-
157
-
158
-
159
-
160
-
161
-
162
-
163
-
164
-
165
-
166
-
167
-
168
-
169
-
170
-
171
-
172
-
173
-
174
-
175
-
176
-
177
-
178
-
179
-
180
-
181
-
182
-
183
-
184
-
185
-
186
-
187
-
188
-
189
-
190
-
191
-
192
-
193
-
194
-
195
-
196
-
197
-
198
-
199
-
200
-
201
-
202
-
203
-
204
-
205
-
206
-
207
-
208
-
209
-
210
-
211
-
212
-
213
-
214
-
215
-
216
-
217
-
218
-
219
-
220
-
221
-
222
-
223
-
224
-
225
-
226
-
227
-
228
-
229
-
230
-
231
-
232
-
233
-
234
-
 235
235 -
 236
236 -
 237
237 -
 238
238 -
 239
239 -
 240
240 -
 241
241 -
 242
242 -
 243
243 -
 244
244 -
 245
245 -
 246
246 -
 247
247 -
 248
248 -
 249
249 -
 250
250 -
 251
251 -
 252
252 -
 253
253 -
 254
254 -
 255
255 -
256
-
257
-
258
-
259
-
260
-
261
-
262
-
263
-
264
-
265
-
266
-
267
-
268
-
269
-
270
-
271
-
272
-
273
-
274
-
275
-
276
-
277
-
278
-
279
-
280
-
281
-
282
-
283
-
284
-
285
-
286
-
287
-
288
-
289
-
290
-
291
-
292
-
293
-
294
-
295
-
296
-
297
-
298
-
299
-
300
-
301
-
302
-
303
-
304
-
305
-
306
-
307
-
308
-
309
-
310
-
311
-
312
-
313
-
314
-
315
-
316
-
317
-
318
-
319
-
320
-
321
-
322
-
323
-
324
-
325
-
326
-
327
-
328
-
329
-
330
-
331
-
332
-
333
-
334
-
335
-
336
-
337
-
338
-
339
-
340
-
341
-
342
-
343
-
344
-
345
-
346
-
347
-
348
-
349
-
350
-
351
-
352
-
353
-
354
-
355
-
356
-
357
-
358
-
359
-
360
-
361
-
362
-
363
-
364
-
365
-
366
-
367
-
368
-
369
-
370
-
371
-
372
-
373
-
374
-
375
-
376
-
377
-
378
-
379
-
380
-
381
-
382
-
383
-
384
-
385
-
386
-
387
-
388
-
389
-
390
-
391
-
392
-
393
-
394
-
395
-
396
-
397
-
398
-
399
-
400
-
401
-
402
-
403
-
404
-
405
-
406
-
407
-
408
-
409
-
410
-
411
-
412
-
413
-
414
-
415
-
416
-
417
-
418
-
419
-
420
-
421
-
422
-
423
-
424
-
425
-
426
-
427
-
428
-
429
-
430
-
431
-
432
-
433
-
434
-
435
-
436
-
437
-
438
-
439
-
440
 |
 |

243
Overview Operating & Financial Review Corporate Governance Financial Statements Shareholder Information
result, the GAC has non-executive responsibility for
oversight of internal controls over financial reporting
and the GRC has non-executive responsibility for
internal controls other than over financial reporting.
The GRC and the GAC have kept under review
the effectiveness of this system of internal control
and have reported regularly to the Board of
Directors. In carrying out their reviews the GRC and
the GAC receive regular business and operational
risk assessments; regular reports from the Group
Chief Risk Officer and the Group Head of Internal
Audit; reports on the annual reviews of the internal
control framework of HSBC Holdings and of major
operating subsidiary companies, in each case
measured against HSBC benchmarks, which cover
all internal controls, both financial and non-
financial; semi-annual confirmations from chief
executives of principal subsidiary companies as to
whether there have been any material losses,
contingencies or uncertainties caused by weaknesses
in internal controls; internal audit reports; external
audit reports; prudential reviews; and regulatory
reports. The GRC monitors the status of top and
emerging risks which impact the Group and
considers whether the mitigating actions put in place
are appropriate. In addition, when unexpected losses
have arisen or when incidents have occurred which
indicate gaps in the control framework or in
adherence to Group policies, the GRC and the GAC
review special reports, prepared at the instigation of
management, which analyse the cause of the issue,
the lessons learned and the actions proposed by
management to address the issue.
The Directors, through the GRC and the GAC,
have conducted an annual review of the effectiveness
of our system of internal control covering all
material controls, including financial, operational
and compliance controls, risk management systems,
the adequacy of resources, qualifications and
experience of staff of the accounting and financial
reporting function, and their training programmes
and budget. The review does not extend to joint
ventures or associates. The GRC and the GAC have
received confirmation that executive management
has taken or is taking the necessary actions to
remedy any failings or weaknesses identified
through the operation of our framework of controls.
Going concern basis
The financial statements are prepared on a going
concern basis, as the Directors are satisfied that the
Group and parent company have the resources to
continue in business for the foreseeable future. In
making this assessment, the Directors have
considered a wide range of information relating
to present and future conditions, including future
projections of profitability, cash flows and capital
resources. Further information relevant to the
assessment is provided elsewhere in this Report.
In particular, HSBC’s principal activities, business
and operating models, strategic direction and top and
emerging risks are described in the ‘Overview’
section; a financial summary, including a review of
the consolidated income statement and consolidated
balance sheet, is provided in the ‘Operating and
Financial Review’ section; and HSBC’s objectives,
policies and processes for managing credit, liquidity
and market risk, and its approach to capital
management and allocation, are described in the
‘Risk’ section.
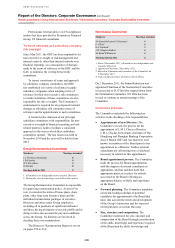
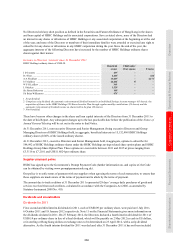
Employees
At 31 December 2011, HSBC employed 298,000
full-time and part-time employees worldwide,
compared with 307,000 at 31 December 2010 and
302,000 at 31 December 2009. The main centres
of employment were the UK with approximately
51,000 employees, India 32,000, Hong Kong 30,000,
the US 24,000, Brazil 24,000, Mexico 19,000,
mainland China 17,000 and France 10,000.
In the context of the current global financial
services operating environment, a high performance
and values-led work force is critical. We encourage
open and honest communication in decision making.
Employment issues and the financial and economic
factors affecting HSBC’s performance are regularly
shared with our employees.
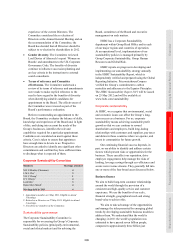
Global People Survey
In 2011, we conducted our fifth Group-wide Global
People Survey, which achieved a participation rate
of 81%. The survey gives employees the opportunity
to provide feedback on their experience of HSBC
and involves them in identifying actions to improve
their experience. Employee engagement improved
1 percentage point from 68% in 2010 to 69% in
2011. This was 2 percentage points higher than the
financial services sector average and 7 percentage
points above the external global average.
Those who participate in our corporate
sustainability initiatives continue to exhibit higher
levels of engagement. Employees reported
improvement on personal aspects of their
employment experience such as work-life balance
and performance management. Their experience
of a values-led culture and effective team working
were also positive. Both were above the financial
sector average with a values-led culture achieving
1 percentage point above the global best in class.