HSBC 2011 Annual Report Download - page 365
Download and view the complete annual report
Please find page 365 of the 2011 HSBC annual report below. You can navigate through the pages in the report by either clicking on the pages listed below, or by using the keyword search tool below to find specific information within the annual report.-
 1
1 -
2
-
3
-
4
-
5
-
6
-
7
-
8
-
9
-
10
-
11
-
12
-
13
-
14
-
15
-
16
-
17
-
18
-
19
-
20
-
21
-
22
-
23
-
24
-
25
-
26
-
27
-
28
-
29
-
30
-
31
-
32
-
33
-
34
-
35
-
36
-
37
-
38
-
39
-
40
-
41
-
42
-
43
-
44
-
45
-
46
-
47
-
48
-
49
-
50
-
51
-
52
-
53
-
54
-
55
-
56
-
57
-
58
-
59
-
60
-
61
-
62
-
63
-
64
-
65
-
66
-
67
-
68
-
69
-
70
-
71
-
72
-
73
-
74
-
75
-
76
-
77
-
78
-
79
-
80
-
81
-
82
-
83
-
84
-
85
-
86
-
87
-
88
-
89
-
90
-
91
-
92
-
93
-
94
-
95
-
96
-
97
-
98
-
99
-
100
-
101
-
102
-
103
-
104
-
105
-
106
-
107
-
108
-
109
-
110
-
111
-
112
-
113
-
114
-
115
-
116
-
117
-
118
-
119
-
120
-
121
-
122
-
123
-
124
-
125
-
126
-
127
-
128
-
129
-
130
-
131
-
132
-
133
-
134
-
135
-
136
-
137
-
138
-
139
-
140
-
141
-
142
-
143
-
144
-
145
-
146
-
147
-
148
-
149
-
150
-
151
-
152
-
153
-
154
-
155
-
156
-
157
-
158
-
159
-
160
-
161
-
162
-
163
-
164
-
165
-
166
-
167
-
168
-
169
-
170
-
171
-
172
-
173
-
174
-
175
-
176
-
177
-
178
-
179
-
180
-
181
-
182
-
183
-
184
-
185
-
186
-
187
-
188
-
189
-
190
-
191
-
192
-
193
-
194
-
195
-
196
-
197
-
198
-
199
-
200
-
201
-
202
-
203
-
204
-
205
-
206
-
207
-
208
-
209
-
210
-
211
-
212
-
213
-
214
-
215
-
216
-
217
-
218
-
219
-
220
-
221
-
222
-
223
-
224
-
225
-
226
-
227
-
228
-
229
-
230
-
231
-
232
-
233
-
234
-
235
-
236
-
237
-
238
-
239
-
240
-
241
-
242
-
243
-
244
-
245
-
246
-
247
-
248
-
249
-
250
-
251
-
252
-
253
-
254
-
255
-
256
-
257
-
258
-
259
-
260
-
261
-
262
-
263
-
264
-
265
-
266
-
267
-
268
-
269
-
270
-
271
-
272
-
273
-
274
-
275
-
276
-
277
-
278
-
279
-
280
-
281
-
282
-
283
-
284
-
285
-
286
-
287
-
288
-
289
-
290
-
291
-
292
-
293
-
294
-
295
-
296
-
297
-
298
-
299
-
300
-
301
-
302
-
303
-
304
-
305
-
306
-
307
-
308
-
309
-
310
-
311
-
312
-
313
-
314
-
315
-
316
-
317
-
318
-
319
-
320
-
321
-
322
-
323
-
324
-
325
-
326
-
327
-
328
-
329
-
330
-
331
-
332
-
333
-
334
-
335
-
336
-
337
-
338
-
339
-
340
-
341
-
342
-
343
-
344
-
345
-
346
-
347
-
348
-
349
-
350
-
351
-
352
-
353
-
354
-
 355
355 -
 356
356 -
 357
357 -
 358
358 -
 359
359 -
 360
360 -
 361
361 -
 362
362 -
 363
363 -
 364
364 -
 365
365 -
 366
366 -
 367
367 -
 368
368 -
 369
369 -
 370
370 -
 371
371 -
 372
372 -
 373
373 -
 374
374 -
 375
375 -
376
-
377
-
378
-
379
-
380
-
381
-
382
-
383
-
384
-
385
-
386
-
387
-
388
-
389
-
390
-
391
-
392
-
393
-
394
-
395
-
396
-
397
-
398
-
399
-
400
-
401
-
402
-
403
-
404
-
405
-
406
-
407
-
408
-
409
-
410
-
411
-
412
-
413
-
414
-
415
-
416
-
417
-
418
-
419
-
420
-
421
-
422
-
423
-
424
-
425
-
426
-
427
-
428
-
429
-
430
-
431
-
432
-
433
-
434
-
435
-
436
-
437
-
438
-
439
-
440
 |
 |

363
Overview Operating & Financial Review Corporate Governance Financial Statements Shareholder Information
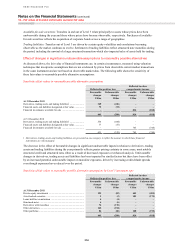
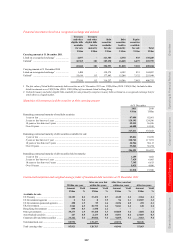
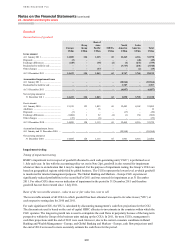
instruments designated at fair value’, together with the gains and losses on the economically hedged items. Where the
derivatives are managed with debt securities in issue, the contractual interest is shown in ‘interest expense’ together
with the interest payable on the issued debt. Substantially all of HSBC Holdings’ derivatives entered into with HSBC
undertakings are managed in conjunction with financial liabilities designated at fair value.
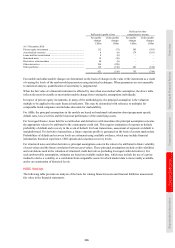
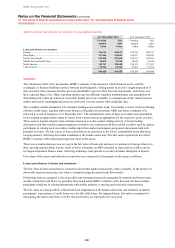
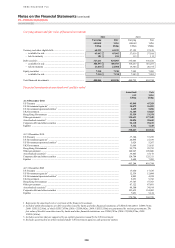
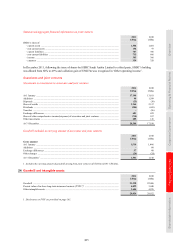
The notional contract amounts of derivatives held for trading purposes indicate the nominal value of transactions
outstanding at the balance sheet date; they do not represent amounts at risk. The 8% increase in the notional amounts
of HSBC’s derivative assets during 2011 was primarily driven by an increase in trading volumes of interest rate and
foreign exchange contracts.
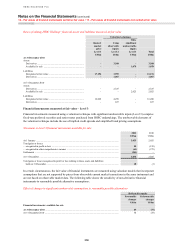
Notional contract amounts of derivatives held for trading purposes by product type
HSBC HSBC Holdings
At
31 December
2011
At
31 December
2010
At
31 December
2011
At
31 December
2010
US$m US$m US$m US$m
Foreign exchange .......................................................................... 3,945,774 3,692,798 18,942 17,287
Interest rate ................................................................................... 19,788,710 18,104,141 10,954 6,804
Equity ............................................................................................ 265,577 294,587 – –
Credit ............................................................................................ 1,049,147 1,065,218 – –
Commodity and other ................................................................... 76,487 82,856 – –
25,125,695 23,239,600 29,896 24,091
Credit derivatives
HSBC trades credit derivatives through its principal dealing operations and acts as a principal counterparty to a broad
range of users, structuring deals to produce risk management products for its customers, or making markets in certain
products. Risk is typically controlled through entering into offsetting credit derivative contracts with other
counterparties.
HSBC manages the credit risk arising on buying and selling credit derivative protection by including the related
credit exposures within its overall credit limit structure for the relevant counterparty. Trading of credit derivatives
is restricted to a small number of offices within the major centres which have the control infrastructure and market
skills to manage effectively the credit risk inherent in the products.
Credit derivatives are also deployed to a limited extent for the risk management of the Group’s loan portfolios.
The notional contract amount of credit derivatives of US$1,049,147m (2010: US$1,065,218m) consisted
of protection bought of US$517,737m (2010: US$530,235m) and protection sold of US$531,410m (2010:
US$534,983m). The credit derivative business operates within the market risk management framework described
on pages 163 to 169.
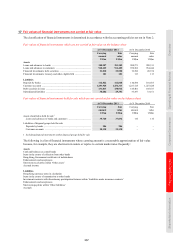
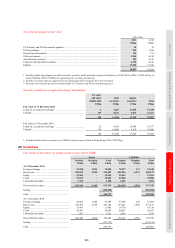
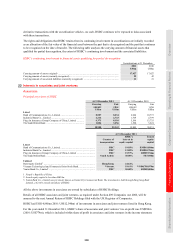
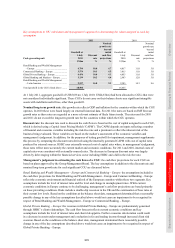
Derivatives valued using models with unobservable inputs
The difference between the fair value at initial recognition (the transaction price) and the value that would have been
derived had valuation techniques used for subsequent measurement been applied at initial recognition, less
subsequent releases, is as follows:
Unamortised balance of derivatives valued using models with significant unobservable inputs
2011 2010
US$m US$m
Unamortised balance at 1 January ............................................................................................................ 250 260
Deferral on new transactions .................................................................................................................... 234 331
Recognised in the income statement during the period:
– amortisation ....................................................................................................................................... (143) (106)
– subsequent to unobservable inputs becoming observable ................................................................ (71) (17)
– maturity, termination or offsetting derivative ................................................................................... (60) (163)
Exchange differences ................................................................................................................................ (2) (15)
Risk hedged .............................................................................................................................................. (8) (40)
Unamortised balance at 31 December1 ..................................................................................................... 200 250
1 This amount is yet to be recognised in the consolidated income statement.