HSBC 2011 Annual Report Download - page 327
Download and view the complete annual report
Please find page 327 of the 2011 HSBC annual report below. You can navigate through the pages in the report by either clicking on the pages listed below, or by using the keyword search tool below to find specific information within the annual report.-
 1
1 -
2
-
3
-
4
-
5
-
6
-
7
-
8
-
9
-
10
-
11
-
12
-
13
-
14
-
15
-
16
-
17
-
18
-
19
-
20
-
21
-
22
-
23
-
24
-
25
-
26
-
27
-
28
-
29
-
30
-
31
-
32
-
33
-
34
-
35
-
36
-
37
-
38
-
39
-
40
-
41
-
42
-
43
-
44
-
45
-
46
-
47
-
48
-
49
-
50
-
51
-
52
-
53
-
54
-
55
-
56
-
57
-
58
-
59
-
60
-
61
-
62
-
63
-
64
-
65
-
66
-
67
-
68
-
69
-
70
-
71
-
72
-
73
-
74
-
75
-
76
-
77
-
78
-
79
-
80
-
81
-
82
-
83
-
84
-
85
-
86
-
87
-
88
-
89
-
90
-
91
-
92
-
93
-
94
-
95
-
96
-
97
-
98
-
99
-
100
-
101
-
102
-
103
-
104
-
105
-
106
-
107
-
108
-
109
-
110
-
111
-
112
-
113
-
114
-
115
-
116
-
117
-
118
-
119
-
120
-
121
-
122
-
123
-
124
-
125
-
126
-
127
-
128
-
129
-
130
-
131
-
132
-
133
-
134
-
135
-
136
-
137
-
138
-
139
-
140
-
141
-
142
-
143
-
144
-
145
-
146
-
147
-
148
-
149
-
150
-
151
-
152
-
153
-
154
-
155
-
156
-
157
-
158
-
159
-
160
-
161
-
162
-
163
-
164
-
165
-
166
-
167
-
168
-
169
-
170
-
171
-
172
-
173
-
174
-
175
-
176
-
177
-
178
-
179
-
180
-
181
-
182
-
183
-
184
-
185
-
186
-
187
-
188
-
189
-
190
-
191
-
192
-
193
-
194
-
195
-
196
-
197
-
198
-
199
-
200
-
201
-
202
-
203
-
204
-
205
-
206
-
207
-
208
-
209
-
210
-
211
-
212
-
213
-
214
-
215
-
216
-
217
-
218
-
219
-
220
-
221
-
222
-
223
-
224
-
225
-
226
-
227
-
228
-
229
-
230
-
231
-
232
-
233
-
234
-
235
-
236
-
237
-
238
-
239
-
240
-
241
-
242
-
243
-
244
-
245
-
246
-
247
-
248
-
249
-
250
-
251
-
252
-
253
-
254
-
255
-
256
-
257
-
258
-
259
-
260
-
261
-
262
-
263
-
264
-
265
-
266
-
267
-
268
-
269
-
270
-
271
-
272
-
273
-
274
-
275
-
276
-
277
-
278
-
279
-
280
-
281
-
282
-
283
-
284
-
285
-
286
-
287
-
288
-
289
-
290
-
291
-
292
-
293
-
294
-
295
-
296
-
297
-
298
-
299
-
300
-
301
-
302
-
303
-
304
-
305
-
306
-
307
-
308
-
309
-
310
-
311
-
312
-
313
-
314
-
315
-
316
-
 317
317 -
 318
318 -
 319
319 -
 320
320 -
 321
321 -
 322
322 -
 323
323 -
 324
324 -
 325
325 -
 326
326 -
 327
327 -
 328
328 -
 329
329 -
 330
330 -
 331
331 -
 332
332 -
 333
333 -
 334
334 -
 335
335 -
 336
336 -
 337
337 -
338
-
339
-
340
-
341
-
342
-
343
-
344
-
345
-
346
-
347
-
348
-
349
-
350
-
351
-
352
-
353
-
354
-
355
-
356
-
357
-
358
-
359
-
360
-
361
-
362
-
363
-
364
-
365
-
366
-
367
-
368
-
369
-
370
-
371
-
372
-
373
-
374
-
375
-
376
-
377
-
378
-
379
-
380
-
381
-
382
-
383
-
384
-
385
-
386
-
387
-
388
-
389
-
390
-
391
-
392
-
393
-
394
-
395
-
396
-
397
-
398
-
399
-
400
-
401
-
402
-
403
-
404
-
405
-
406
-
407
-
408
-
409
-
410
-
411
-
412
-
413
-
414
-
415
-
416
-
417
-
418
-
419
-
420
-
421
-
422
-
423
-
424
-
425
-
426
-
427
-
428
-
429
-
430
-
431
-
432
-
433
-
434
-
435
-
436
-
437
-
438
-
439
-
440
 |
 |

325
Overview Operating & Financial Review Corporate Governance Financial Statements Shareholder Information
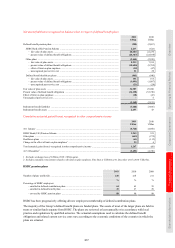
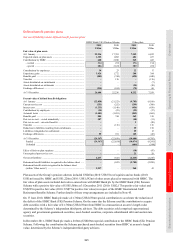
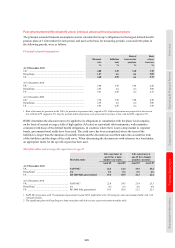
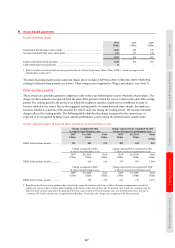
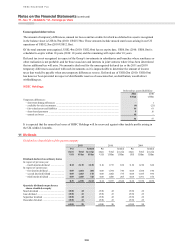
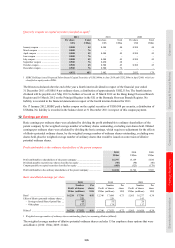
The effect of changes in the discount rate and in mortality rates on plans other than the principal plan
Other plans
2011 2010
US$m US$m
Change in defined benefit obligation at year end from a 25bps increase in discount rate ...................... (325) (290)
Change in 2012 pension cost from a 25bps increase in discount rate ..................................................... – (1)
Increase in defined benefit obligation from each additional year of longevity assumed ........................ 144 131
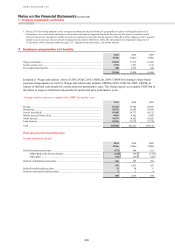
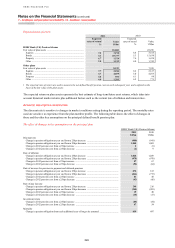
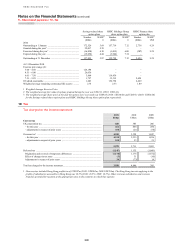
HSBC Holdings
Employee compensation and benefit expense in respect of HSBC Holdings’ employees in 2011 amounted to
US$413m (2010: US$244m). The average number of persons employed by HSBC Holdings during 2011 was 1,212
(2010: 1,015).
Employees of HSBC Holdings who are members of defined benefit pension plans are principally members of either
the HSBC Bank (UK) Pension Scheme or the HSBC International Staff Retirement Benefits Scheme. HSBC
Holdings pays contributions to such plans for its own employees in accordance with the schedules of contributions
determined by the Trustees of the plan.
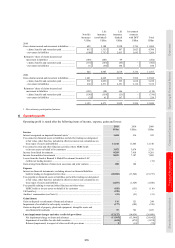
Directors’ emoluments
The aggregate emoluments of the Directors of HSBC Holdings, computed in accordance with the Companies Act
2006 and the Large and Medium-sized Companies and Groups (Accounts and Reports) Regulations 2008 were:
2011 2010 2009
US$000 US$000 US$000
Fees ............................................................................................................................. 5,108 3,597 3,756
Salaries and other emoluments ................................................................................... 12,906 12,841 11,835
Bonuses ....................................................................................................................... 12,516 14,294 –
30,530 30,732 15,591
Vesting of long-term incentive awards ...................................................................... 2,596 8,523 1,579
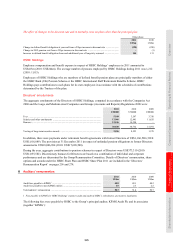
In addition, there were payments under retirement benefit agreements with former Directors of US$1,166,580 (2010:
US$1,016,089). The provision at 31 December 2011 in respect of unfunded pension obligations to former Directors
amounted to US$18,006,894 (2010: US$17,628,508).
During the year, aggregate contributions to pension schemes in respect of Directors were US$373,310 (2010:
US$1,055,582). Discretionary bonuses for Directors are based on a combination of individual and corporate
performance and are determined by the Group Remuneration Committee. Details of Directors’ remuneration, share
options and awards under the HSBC Share Plan and HSBC Share Plan 2011 are included in the ‘Directors’
Remuneration Report’ on pages 256 and 274.
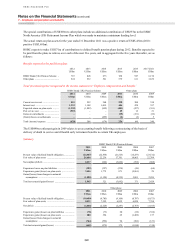
8 Auditors’ remuneration
2011 2010 2009
US$m US$m US$m
Audit fees payable to KPMG1 .................................................................................... 48.8 49.1 48.2
Audit fees payable to non-KPMG entities ................................................................. 1.9 2.3 2.5
Total auditors’ remuneration ...................................................................................... 50.7 51.4 50.7
1 Fees payable to KPMG for HSBC Holdings’ statutory audit and audit of HSBC’s subsidiaries, pursuant to legislation.
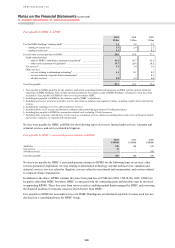
The following fees were payable by HSBC to the Group’s principal auditor, KPMG Audit Plc and its associates
(together ‘KPMG’):