HSBC 2011 Annual Report Download - page 95
Download and view the complete annual report
Please find page 95 of the 2011 HSBC annual report below. You can navigate through the pages in the report by either clicking on the pages listed below, or by using the keyword search tool below to find specific information within the annual report.-
 1
1 -
2
-
3
-
4
-
5
-
6
-
7
-
8
-
9
-
10
-
11
-
12
-
13
-
14
-
15
-
16
-
17
-
18
-
19
-
20
-
21
-
22
-
23
-
24
-
25
-
26
-
27
-
28
-
29
-
30
-
31
-
32
-
33
-
34
-
35
-
36
-
37
-
38
-
39
-
40
-
41
-
42
-
43
-
44
-
45
-
46
-
47
-
48
-
49
-
50
-
51
-
52
-
53
-
54
-
55
-
56
-
57
-
58
-
59
-
60
-
61
-
62
-
63
-
64
-
65
-
66
-
67
-
68
-
69
-
70
-
71
-
72
-
73
-
74
-
75
-
76
-
77
-
78
-
79
-
80
-
81
-
82
-
83
-
84
-
 85
85 -
 86
86 -
 87
87 -
 88
88 -
 89
89 -
 90
90 -
 91
91 -
 92
92 -
 93
93 -
 94
94 -
 95
95 -
 96
96 -
 97
97 -
 98
98 -
 99
99 -
 100
100 -
 101
101 -
 102
102 -
 103
103 -
 104
104 -
 105
105 -
106
-
107
-
108
-
109
-
110
-
111
-
112
-
113
-
114
-
115
-
116
-
117
-
118
-
119
-
120
-
121
-
122
-
123
-
124
-
125
-
126
-
127
-
128
-
129
-
130
-
131
-
132
-
133
-
134
-
135
-
136
-
137
-
138
-
139
-
140
-
141
-
142
-
143
-
144
-
145
-
146
-
147
-
148
-
149
-
150
-
151
-
152
-
153
-
154
-
155
-
156
-
157
-
158
-
159
-
160
-
161
-
162
-
163
-
164
-
165
-
166
-
167
-
168
-
169
-
170
-
171
-
172
-
173
-
174
-
175
-
176
-
177
-
178
-
179
-
180
-
181
-
182
-
183
-
184
-
185
-
186
-
187
-
188
-
189
-
190
-
191
-
192
-
193
-
194
-
195
-
196
-
197
-
198
-
199
-
200
-
201
-
202
-
203
-
204
-
205
-
206
-
207
-
208
-
209
-
210
-
211
-
212
-
213
-
214
-
215
-
216
-
217
-
218
-
219
-
220
-
221
-
222
-
223
-
224
-
225
-
226
-
227
-
228
-
229
-
230
-
231
-
232
-
233
-
234
-
235
-
236
-
237
-
238
-
239
-
240
-
241
-
242
-
243
-
244
-
245
-
246
-
247
-
248
-
249
-
250
-
251
-
252
-
253
-
254
-
255
-
256
-
257
-
258
-
259
-
260
-
261
-
262
-
263
-
264
-
265
-
266
-
267
-
268
-
269
-
270
-
271
-
272
-
273
-
274
-
275
-
276
-
277
-
278
-
279
-
280
-
281
-
282
-
283
-
284
-
285
-
286
-
287
-
288
-
289
-
290
-
291
-
292
-
293
-
294
-
295
-
296
-
297
-
298
-
299
-
300
-
301
-
302
-
303
-
304
-
305
-
306
-
307
-
308
-
309
-
310
-
311
-
312
-
313
-
314
-
315
-
316
-
317
-
318
-
319
-
320
-
321
-
322
-
323
-
324
-
325
-
326
-
327
-
328
-
329
-
330
-
331
-
332
-
333
-
334
-
335
-
336
-
337
-
338
-
339
-
340
-
341
-
342
-
343
-
344
-
345
-
346
-
347
-
348
-
349
-
350
-
351
-
352
-
353
-
354
-
355
-
356
-
357
-
358
-
359
-
360
-
361
-
362
-
363
-
364
-
365
-
366
-
367
-
368
-
369
-
370
-
371
-
372
-
373
-
374
-
375
-
376
-
377
-
378
-
379
-
380
-
381
-
382
-
383
-
384
-
385
-
386
-
387
-
388
-
389
-
390
-
391
-
392
-
393
-
394
-
395
-
396
-
397
-
398
-
399
-
400
-
401
-
402
-
403
-
404
-
405
-
406
-
407
-
408
-
409
-
410
-
411
-
412
-
413
-
414
-
415
-
416
-
417
-
418
-
419
-
420
-
421
-
422
-
423
-
424
-
425
-
426
-
427
-
428
-
429
-
430
-
431
-
432
-
433
-
434
-
435
-
436
-
437
-
438
-
439
-
440
 |
 |

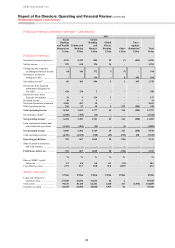
93
Overview Operating & Financial Review Corporate Governance Financial Statements Shareholder Information
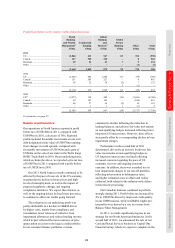
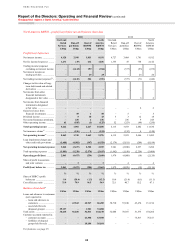
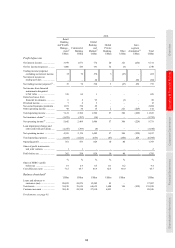
2010
Retail
Banking
and Wealth
Manage-
ment17
US$m
Commercial
Banking
US$m
Global
Banking
and
Markets17
US$m
Global
Private
Banking
US$m
Other
US$m
Inter-
segment
elimination64
US$m
Total
US$m
Profit before tax
Net interest income ..................... 3,979 1,671 772 20 121 (252) 6,311
Net fee income/(expense) ........... 1,006 526 191 32 (6) – 1,749
Trading income/(expense)
excluding net interest income 35 72 370 3 (27) – 453
Net interest income on
trading activities ..................... – – 28 – – 252 280
Net trading income/(expense)56 .. 35 72 398 3 (27) 252 733
Net income from financial
instruments designated
at fair value ............................. 339 85 1 – – – 425
Gains less losses from
financial investments .............. 6 2 93 – (3) – 98
Dividend income ......................... 7 2 3 – – – 12
Net earned insurance premiums . 1,651 374 29 – – – 2,054
Other operating income .............. 98 34 15 2 221 (229) 141
Total operating income ............... 7,121 2,766 1,502 57 306 (229) 11,523
Net insurance claims65 ................ (1,479) (297) (16) – – – (1,792)
Net operating income52 ............... 5,642 2,469 1,486 57 306 (229) 9,731
Loan impairment charges and
other credit risk provisions ..... (1,247) (293) (4) – – – (1,544)
Net operating income ................. 4,395 2,176 1,482 57 306 (229) 8,187
Total operating expenses ............ (4,034) (1,623) (653) (47) (266) 229 (6,394)
Operating profit .......................... 361 553 829 10 40 – 1,793
Share of profit in associates
and joint ventures ................... 1 1 – – – – 2
Profit before tax .......................... 362 554 829 10 40 – 1,795
% % % % % %
Share of HSBC’s profit
before tax ................................ 1.9 2.9 4.3 0.1 0.2 9.4
Cost efficiency ratio ................... 71.5 65.7 43.9 82.5 86.9 65.7
Balance sheet data49
US$m US$m US$m US$m US$m US$m
Loans and advances to
customers (net) ....................... 20,823 24,879 12,242 43 – 57,987
Total assets ................................. 38,819 35,619 64,635 1,608 196 (939) 139,938
Customer accounts ...................... 30,149 24,514 27,810 6,053 – 88,526
For footnotes, see page 95.