HSBC 2011 Annual Report Download - page 269
Download and view the complete annual report
Please find page 269 of the 2011 HSBC annual report below. You can navigate through the pages in the report by either clicking on the pages listed below, or by using the keyword search tool below to find specific information within the annual report.-
 1
1 -
2
-
3
-
4
-
5
-
6
-
7
-
8
-
9
-
10
-
11
-
12
-
13
-
14
-
15
-
16
-
17
-
18
-
19
-
20
-
21
-
22
-
23
-
24
-
25
-
26
-
27
-
28
-
29
-
30
-
31
-
32
-
33
-
34
-
35
-
36
-
37
-
38
-
39
-
40
-
41
-
42
-
43
-
44
-
45
-
46
-
47
-
48
-
49
-
50
-
51
-
52
-
53
-
54
-
55
-
56
-
57
-
58
-
59
-
60
-
61
-
62
-
63
-
64
-
65
-
66
-
67
-
68
-
69
-
70
-
71
-
72
-
73
-
74
-
75
-
76
-
77
-
78
-
79
-
80
-
81
-
82
-
83
-
84
-
85
-
86
-
87
-
88
-
89
-
90
-
91
-
92
-
93
-
94
-
95
-
96
-
97
-
98
-
99
-
100
-
101
-
102
-
103
-
104
-
105
-
106
-
107
-
108
-
109
-
110
-
111
-
112
-
113
-
114
-
115
-
116
-
117
-
118
-
119
-
120
-
121
-
122
-
123
-
124
-
125
-
126
-
127
-
128
-
129
-
130
-
131
-
132
-
133
-
134
-
135
-
136
-
137
-
138
-
139
-
140
-
141
-
142
-
143
-
144
-
145
-
146
-
147
-
148
-
149
-
150
-
151
-
152
-
153
-
154
-
155
-
156
-
157
-
158
-
159
-
160
-
161
-
162
-
163
-
164
-
165
-
166
-
167
-
168
-
169
-
170
-
171
-
172
-
173
-
174
-
175
-
176
-
177
-
178
-
179
-
180
-
181
-
182
-
183
-
184
-
185
-
186
-
187
-
188
-
189
-
190
-
191
-
192
-
193
-
194
-
195
-
196
-
197
-
198
-
199
-
200
-
201
-
202
-
203
-
204
-
205
-
206
-
207
-
208
-
209
-
210
-
211
-
212
-
213
-
214
-
215
-
216
-
217
-
218
-
219
-
220
-
221
-
222
-
223
-
224
-
225
-
226
-
227
-
228
-
229
-
230
-
231
-
232
-
233
-
234
-
235
-
236
-
237
-
238
-
239
-
240
-
241
-
242
-
243
-
244
-
245
-
246
-
247
-
248
-
249
-
250
-
251
-
252
-
253
-
254
-
255
-
256
-
257
-
258
-
 259
259 -
 260
260 -
 261
261 -
 262
262 -
 263
263 -
 264
264 -
 265
265 -
 266
266 -
 267
267 -
 268
268 -
 269
269 -
 270
270 -
 271
271 -
 272
272 -
 273
273 -
 274
274 -
 275
275 -
 276
276 -
 277
277 -
 278
278 -
 279
279 -
280
-
281
-
282
-
283
-
284
-
285
-
286
-
287
-
288
-
289
-
290
-
291
-
292
-
293
-
294
-
295
-
296
-
297
-
298
-
299
-
300
-
301
-
302
-
303
-
304
-
305
-
306
-
307
-
308
-
309
-
310
-
311
-
312
-
313
-
314
-
315
-
316
-
317
-
318
-
319
-
320
-
321
-
322
-
323
-
324
-
325
-
326
-
327
-
328
-
329
-
330
-
331
-
332
-
333
-
334
-
335
-
336
-
337
-
338
-
339
-
340
-
341
-
342
-
343
-
344
-
345
-
346
-
347
-
348
-
349
-
350
-
351
-
352
-
353
-
354
-
355
-
356
-
357
-
358
-
359
-
360
-
361
-
362
-
363
-
364
-
365
-
366
-
367
-
368
-
369
-
370
-
371
-
372
-
373
-
374
-
375
-
376
-
377
-
378
-
379
-
380
-
381
-
382
-
383
-
384
-
385
-
386
-
387
-
388
-
389
-
390
-
391
-
392
-
393
-
394
-
395
-
396
-
397
-
398
-
399
-
400
-
401
-
402
-
403
-
404
-
405
-
406
-
407
-
408
-
409
-
410
-
411
-
412
-
413
-
414
-
415
-
416
-
417
-
418
-
419
-
420
-
421
-
422
-
423
-
424
-
425
-
426
-
427
-
428
-
429
-
430
-
431
-
432
-
433
-
434
-
435
-
436
-
437
-
438
-
439
-
440
 |
 |

267
Overview Operating & Financial Review Corporate Governance Financial Statements Shareholder Information
EPS growth in year 3 over
the base EPS
Proportion of EPS
award vesting1
28% or above 100%
16% 20%
< 16% nil
1 Vesting occurred in a straight line between 20% and 100%
where our performance fell between these incremental steps.
Funding
The dilution limits set out in the HSBC share
plans comply with the Association of British
Insurers’ guidelines. To date, all awards of
Performance Shares and Restricted Shares vesting
under the HSBC Share Plan have been satisfied by
the transfer of existing shares. To create additional
core tier 1 capital and retain funds within HSBC, the
Board has agreed that new shares may be issued to
satisfy the vesting of Restricted Shares awards and
GPSP awards that cannot be satisfied from shares
already held by employee benefit trusts.
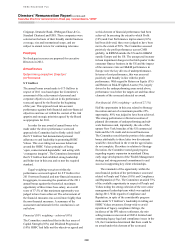
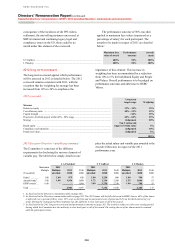
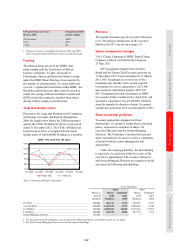
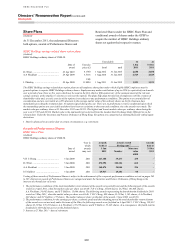
Total shareholder return
Pursuant to the Large and Medium-sized Companies
and Groups (Accounts and Reports) Regulations
2008, the graph below shows the TSR performance
against the FTSE 100 Index for the five-year period
ended 31 December 2011. The FTSE 100 Index has
been chosen as this is a recognised broad equity
market index of which HSBC Holdings is a member.
HSBC TSR and FTSE 100 Index
70%
80%
90%
100%
110%
120%
Dec 2006 Dec 2007 Dec 2008 Dec 2009 Dec 2010 Dec 2011
HSBC TSR FTSE 100
Source: International Data Corporation
Pensions
The normal retirement age for executive Directors
is 65. The pension entitlements of the executive
Directors for 2011 are set out on page 271.
Senior management changes
V H C Cheng, Chairman of HSBC Bank (China)
Company Limited, retired from the Group on
27 May 2011.
M F Geoghegan stepped down from the
Board and his Group Chief Executive position on
31 December 2010. Upon retirement on 31 March
2011, M F Geoghegan received in lieu of the
remaining nine months’ notice period required
to terminate the service agreement, £1,027,500
and a pension contribution equal to £401,250.
M F Geoghegan provided consultancy to HSBC
for a period of three months from 1 April 2011 and
was paid a consultancy fee of £200,000, which he
stated he intended to donate to charity. No annual
variable pay award has been recommended for 2011.
Share ownership guidelines
To ensure appropriate alignment with our
shareholders, we operate a formal share ownership
policy, expressed as a number of shares, for
executive Directors and the Group Managing
Directors. The Committee considers that material
share ownership by executives creates a community
of interest between senior management and
shareholders.
Under the existing guidelines, the shareholding
is expected to be achieved within five years of the
executive’s appointment. The executive Directors
and Group Managing Directors are required to build
and retain the following shareholdings:
At 31 December
2011 2010
Shares to
be held1
Shares
held1
Estimated
value
Shares
held1
Estimated
value
(Number) (Number) £000 (Number) £000
D J Flint ............................................................................................... 400,000 626,342 3,076 494,933 3,223
A A Flockhart ...................................................................................... 200,000 1,420,535 6,976 1,066,450 6,944
S T Gulliver ......................................................................................... 600,000 4,892,014 24,025 4,279,244 27,862
I J Mackay ........................................................................................... 200,000 424,735 2,086 287,719 1,873
Group Managing Directors .................................................................. 125,000 –2– –2 –
1 For the purposes of the guidelines, unvested awards of Restricted Shares and GPSP awards are included.
2 All of the Group Managing Directors exceed the expected holdings.