HSBC 2011 Annual Report Download - page 66
Download and view the complete annual report
Please find page 66 of the 2011 HSBC annual report below. You can navigate through the pages in the report by either clicking on the pages listed below, or by using the keyword search tool below to find specific information within the annual report.-
 1
1 -
2
-
3
-
4
-
5
-
6
-
7
-
8
-
9
-
10
-
11
-
12
-
13
-
14
-
15
-
16
-
17
-
18
-
19
-
20
-
21
-
22
-
23
-
24
-
25
-
26
-
27
-
28
-
29
-
30
-
31
-
32
-
33
-
34
-
35
-
36
-
37
-
38
-
39
-
40
-
41
-
42
-
43
-
44
-
45
-
46
-
47
-
48
-
49
-
50
-
51
-
52
-
53
-
54
-
55
-
 56
56 -
 57
57 -
 58
58 -
 59
59 -
 60
60 -
 61
61 -
 62
62 -
 63
63 -
 64
64 -
 65
65 -
 66
66 -
 67
67 -
 68
68 -
 69
69 -
 70
70 -
 71
71 -
 72
72 -
 73
73 -
 74
74 -
 75
75 -
 76
76 -
77
-
78
-
79
-
80
-
81
-
82
-
83
-
84
-
85
-
86
-
87
-
88
-
89
-
90
-
91
-
92
-
93
-
94
-
95
-
96
-
97
-
98
-
99
-
100
-
101
-
102
-
103
-
104
-
105
-
106
-
107
-
108
-
109
-
110
-
111
-
112
-
113
-
114
-
115
-
116
-
117
-
118
-
119
-
120
-
121
-
122
-
123
-
124
-
125
-
126
-
127
-
128
-
129
-
130
-
131
-
132
-
133
-
134
-
135
-
136
-
137
-
138
-
139
-
140
-
141
-
142
-
143
-
144
-
145
-
146
-
147
-
148
-
149
-
150
-
151
-
152
-
153
-
154
-
155
-
156
-
157
-
158
-
159
-
160
-
161
-
162
-
163
-
164
-
165
-
166
-
167
-
168
-
169
-
170
-
171
-
172
-
173
-
174
-
175
-
176
-
177
-
178
-
179
-
180
-
181
-
182
-
183
-
184
-
185
-
186
-
187
-
188
-
189
-
190
-
191
-
192
-
193
-
194
-
195
-
196
-
197
-
198
-
199
-
200
-
201
-
202
-
203
-
204
-
205
-
206
-
207
-
208
-
209
-
210
-
211
-
212
-
213
-
214
-
215
-
216
-
217
-
218
-
219
-
220
-
221
-
222
-
223
-
224
-
225
-
226
-
227
-
228
-
229
-
230
-
231
-
232
-
233
-
234
-
235
-
236
-
237
-
238
-
239
-
240
-
241
-
242
-
243
-
244
-
245
-
246
-
247
-
248
-
249
-
250
-
251
-
252
-
253
-
254
-
255
-
256
-
257
-
258
-
259
-
260
-
261
-
262
-
263
-
264
-
265
-
266
-
267
-
268
-
269
-
270
-
271
-
272
-
273
-
274
-
275
-
276
-
277
-
278
-
279
-
280
-
281
-
282
-
283
-
284
-
285
-
286
-
287
-
288
-
289
-
290
-
291
-
292
-
293
-
294
-
295
-
296
-
297
-
298
-
299
-
300
-
301
-
302
-
303
-
304
-
305
-
306
-
307
-
308
-
309
-
310
-
311
-
312
-
313
-
314
-
315
-
316
-
317
-
318
-
319
-
320
-
321
-
322
-
323
-
324
-
325
-
326
-
327
-
328
-
329
-
330
-
331
-
332
-
333
-
334
-
335
-
336
-
337
-
338
-
339
-
340
-
341
-
342
-
343
-
344
-
345
-
346
-
347
-
348
-
349
-
350
-
351
-
352
-
353
-
354
-
355
-
356
-
357
-
358
-
359
-
360
-
361
-
362
-
363
-
364
-
365
-
366
-
367
-
368
-
369
-
370
-
371
-
372
-
373
-
374
-
375
-
376
-
377
-
378
-
379
-
380
-
381
-
382
-
383
-
384
-
385
-
386
-
387
-
388
-
389
-
390
-
391
-
392
-
393
-
394
-
395
-
396
-
397
-
398
-
399
-
400
-
401
-
402
-
403
-
404
-
405
-
406
-
407
-
408
-
409
-
410
-
411
-
412
-
413
-
414
-
415
-
416
-
417
-
418
-
419
-
420
-
421
-
422
-
423
-
424
-
425
-
426
-
427
-
428
-
429
-
430
-
431
-
432
-
433
-
434
-
435
-
436
-
437
-
438
-
439
-
440
 |
 |

HSBC HOLDINGS PLC
Report of the Directors: Operating and Financial Review (continued)
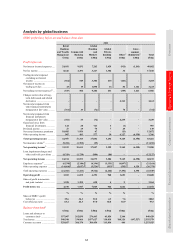
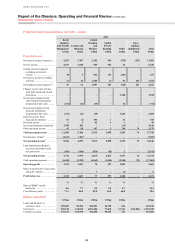
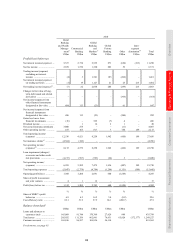
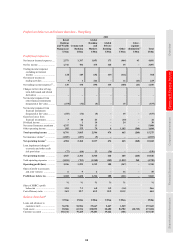
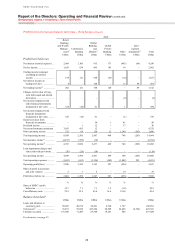
Geographical regions > Europe
64
Profit/(loss) before tax and balance sheet data – Europe
2011
Retail
Banking
and Wealth
Management
US$m
Commercial
Banking
US$m
Global
Banking
and
Markets
US$m
Global
Private
Banking
US$m
Other
US$m
Inter-
segment
elimination64
US$m
Total
US$m
Profit before tax
Net interest income/(expense) .... 5,653 3,107 2,102 936 (574) (223) 11,001
Net fee income ............................ 2,633 1,640 989 942 32 – 6,236
Trading income/(expense)
excluding net interest
income .................................... 40 5 602 191 (201) – 637
Net interest income on trading
activities .................................. 11 16 1,205 16 53 223 1,524
Net trading income/(expense)56 .. 51 21 1,807 207 (148) 223 2,161
Changes in fair value of long-
term debt issued and related
derivatives .............................. – – – – 3,180 – 3,180
Net income/(expense) from
other financial instruments
designated at fair value ........... (672) (21) (65) –46 – (712)
Net income/(expense) from
financial instruments
designated at fair value ........... (672) (21) (65) – 3,226 – 2,468
Gains less losses from
financial investments .............. 51 (1) 453 1 11 – 515
Dividend income ......................... 1 1 42 4 1 – 49
Net earned insurance premiums . 3,768 381 – – (13) – 4,136
Other operating income .............. 95 58 187 5 760 74 1,179
Total operating income ............ 11,580 5,186 5,515 2,095 3,295 74 27,745
Net insurance claims65 ................ (3,212) (287) – – – – (3,499)
Net operating income52 ............. 8,368 4,899 5,515 2,095 3,295 74 24,246
Loan impairment (charges)/
recoveries and other credit
risk provisions ........................ (596) (960) (876) (82) 2 – (2,512)
Net operating income ............... 7,772 3,939 4,639 2,013 3,297 74 21,734
Total operating expenses ............ (6,450) (2,252) (4,569) (1,456) (2,268) (74) (17,069)
Operating profit ........................ 1,322 1,687 70 557 1,029 – 4,665
Share of profit/(loss) in associates
and joint ventures ................... – – 7 – (1) – 6
Profit before tax ........................ 1,322 1,687 77 557 1,028 – 4,671
% % % % % %
Share of HSBC’s profit
before tax ................................ 6.0 7.7 0.4 2.5 4.7 21.3
Cost efficiency ratio ................... 77.1 46.0 82.8 69.5 68.8 70.4
Balance sheet data49
US$m US$m US$m US$m US$m US$m
Loans and advances to
customers (net) ....................... 150,205 98,154 156,903 28,378 696 434,336
Total assets ................................. 210,140 124,049 1,021,486 77,410 63,141 (214,281) 1,281,945
Customer accounts ...................... 176,134 104,530 154,208 58,265 267 493,404