HSBC 2011 Annual Report Download - page 318
Download and view the complete annual report
Please find page 318 of the 2011 HSBC annual report below. You can navigate through the pages in the report by either clicking on the pages listed below, or by using the keyword search tool below to find specific information within the annual report.-
 1
1 -
2
-
3
-
4
-
5
-
6
-
7
-
8
-
9
-
10
-
11
-
12
-
13
-
14
-
15
-
16
-
17
-
18
-
19
-
20
-
21
-
22
-
23
-
24
-
25
-
26
-
27
-
28
-
29
-
30
-
31
-
32
-
33
-
34
-
35
-
36
-
37
-
38
-
39
-
40
-
41
-
42
-
43
-
44
-
45
-
46
-
47
-
48
-
49
-
50
-
51
-
52
-
53
-
54
-
55
-
56
-
57
-
58
-
59
-
60
-
61
-
62
-
63
-
64
-
65
-
66
-
67
-
68
-
69
-
70
-
71
-
72
-
73
-
74
-
75
-
76
-
77
-
78
-
79
-
80
-
81
-
82
-
83
-
84
-
85
-
86
-
87
-
88
-
89
-
90
-
91
-
92
-
93
-
94
-
95
-
96
-
97
-
98
-
99
-
100
-
101
-
102
-
103
-
104
-
105
-
106
-
107
-
108
-
109
-
110
-
111
-
112
-
113
-
114
-
115
-
116
-
117
-
118
-
119
-
120
-
121
-
122
-
123
-
124
-
125
-
126
-
127
-
128
-
129
-
130
-
131
-
132
-
133
-
134
-
135
-
136
-
137
-
138
-
139
-
140
-
141
-
142
-
143
-
144
-
145
-
146
-
147
-
148
-
149
-
150
-
151
-
152
-
153
-
154
-
155
-
156
-
157
-
158
-
159
-
160
-
161
-
162
-
163
-
164
-
165
-
166
-
167
-
168
-
169
-
170
-
171
-
172
-
173
-
174
-
175
-
176
-
177
-
178
-
179
-
180
-
181
-
182
-
183
-
184
-
185
-
186
-
187
-
188
-
189
-
190
-
191
-
192
-
193
-
194
-
195
-
196
-
197
-
198
-
199
-
200
-
201
-
202
-
203
-
204
-
205
-
206
-
207
-
208
-
209
-
210
-
211
-
212
-
213
-
214
-
215
-
216
-
217
-
218
-
219
-
220
-
221
-
222
-
223
-
224
-
225
-
226
-
227
-
228
-
229
-
230
-
231
-
232
-
233
-
234
-
235
-
236
-
237
-
238
-
239
-
240
-
241
-
242
-
243
-
244
-
245
-
246
-
247
-
248
-
249
-
250
-
251
-
252
-
253
-
254
-
255
-
256
-
257
-
258
-
259
-
260
-
261
-
262
-
263
-
264
-
265
-
266
-
267
-
268
-
269
-
270
-
271
-
272
-
273
-
274
-
275
-
276
-
277
-
278
-
279
-
280
-
281
-
282
-
283
-
284
-
285
-
286
-
287
-
288
-
289
-
290
-
291
-
292
-
293
-
294
-
295
-
296
-
297
-
298
-
299
-
300
-
301
-
302
-
303
-
304
-
305
-
306
-
307
-
 308
308 -
 309
309 -
 310
310 -
 311
311 -
 312
312 -
 313
313 -
 314
314 -
 315
315 -
 316
316 -
 317
317 -
 318
318 -
 319
319 -
 320
320 -
 321
321 -
 322
322 -
 323
323 -
 324
324 -
 325
325 -
 326
326 -
 327
327 -
 328
328 -
329
-
330
-
331
-
332
-
333
-
334
-
335
-
336
-
337
-
338
-
339
-
340
-
341
-
342
-
343
-
344
-
345
-
346
-
347
-
348
-
349
-
350
-
351
-
352
-
353
-
354
-
355
-
356
-
357
-
358
-
359
-
360
-
361
-
362
-
363
-
364
-
365
-
366
-
367
-
368
-
369
-
370
-
371
-
372
-
373
-
374
-
375
-
376
-
377
-
378
-
379
-
380
-
381
-
382
-
383
-
384
-
385
-
386
-
387
-
388
-
389
-
390
-
391
-
392
-
393
-
394
-
395
-
396
-
397
-
398
-
399
-
400
-
401
-
402
-
403
-
404
-
405
-
406
-
407
-
408
-
409
-
410
-
411
-
412
-
413
-
414
-
415
-
416
-
417
-
418
-
419
-
420
-
421
-
422
-
423
-
424
-
425
-
426
-
427
-
428
-
429
-
430
-
431
-
432
-
433
-
434
-
435
-
436
-
437
-
438
-
439
-
440
 |
 |

HSBC HOLDINGS PLC
Notes on the Financial Statements (continued)
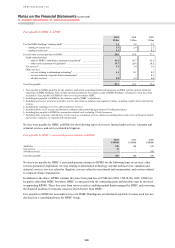
7 – Employee compensation and benefits
316
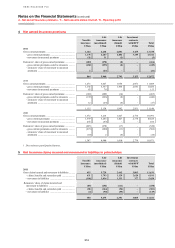
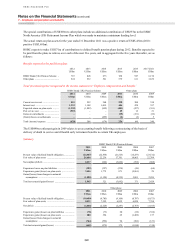
1 During 2011 the Group adopted a more stringent treatment for impaired loans for geographical regions with significant levels of
forbearance. As a result loans and advances have been classified as impaired that under the previous disclosure convention would
otherwise have been classified as neither past due nor impaired or past due but not impaired. The effect of this change on 2011 reported
numbers was to increase interest earned on impaired loans from US$0.3bn to US$1.5bn. Restatement of comparative data prior to
31 December 2010 is impracticable (see page 133, ‘Impaired loans disclosure’, for further details).
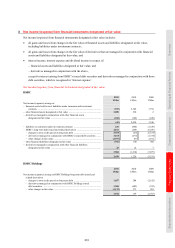
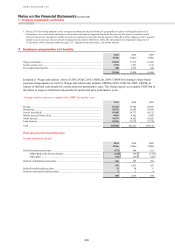
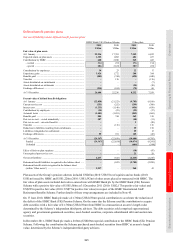
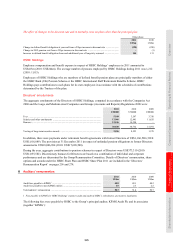
7 Employee compensation and benefits
2011 2010 2009
US$m US$m US$m
Wages and salaries ...................................................................................................... 18,923 17,193 16,268
Social security costs .................................................................................................... 1,754 1,567 1,512
Post-employment benefits .......................................................................................... 489 1,076 688
21,166 19,836 18,468
Included in ‘Wages and salaries’ above is US$1,162m (2010: US$812m; 2009: US$683m) relating to share-based
payment arrangements (see Note 9). Wages and salaries also includes US$88m (2010: US$15m; 2009: US$5m) in
respect of deferred cash awards for current and prior performance years. The Group expects to recognise US$159m in
the future in respect of deferred cash awards for current and prior performance years.
Average number of persons employed by HSBC during the year
2011 2010 2009
Europe ......................................................................................................................... 81,263 79,902 84,056
Hong Kong ................................................................................................................. 30,323 29,105 28,894
Rest of Asia-Pacific .................................................................................................... 92,685 89,737 88,122
Middle East and North Africa .................................................................................... 8,816 8,983 8,468
North America ............................................................................................................ 34,871 36,822 42,202
Latin America ............................................................................................................. 58,026 57,778 57,774
Total ............................................................................................................................ 305,984 302,327 309,516
Post-employment benefit plans
Income statement charge
2011 2010 2009
US$m US$m US$m
Defined benefit pension plans .................................................................................... (172) 468 161
– HSBC Bank (UK) Pension Scheme ................................................................ (428) 308 (179)
– Other plans ...................................................................................................... 256 160 340
Defined contribution pension plans ........................................................................... 626 545 492
454 1,013 653
Defined benefit healthcare plans ................................................................................ 32 58 31
Defined contribution healthcare plans ........................................................................ 3 5 4
489 1,076 688