HSBC 2011 Annual Report Download - page 48
Download and view the complete annual report
Please find page 48 of the 2011 HSBC annual report below. You can navigate through the pages in the report by either clicking on the pages listed below, or by using the keyword search tool below to find specific information within the annual report.-
 1
1 -
2
-
3
-
4
-
5
-
6
-
7
-
8
-
9
-
10
-
11
-
12
-
13
-
14
-
15
-
16
-
17
-
18
-
19
-
20
-
21
-
22
-
23
-
24
-
25
-
26
-
27
-
28
-
29
-
30
-
31
-
32
-
33
-
34
-
35
-
36
-
37
-
 38
38 -
 39
39 -
 40
40 -
 41
41 -
 42
42 -
 43
43 -
 44
44 -
 45
45 -
 46
46 -
 47
47 -
 48
48 -
 49
49 -
 50
50 -
 51
51 -
 52
52 -
 53
53 -
 54
54 -
 55
55 -
 56
56 -
 57
57 -
 58
58 -
59
-
60
-
61
-
62
-
63
-
64
-
65
-
66
-
67
-
68
-
69
-
70
-
71
-
72
-
73
-
74
-
75
-
76
-
77
-
78
-
79
-
80
-
81
-
82
-
83
-
84
-
85
-
86
-
87
-
88
-
89
-
90
-
91
-
92
-
93
-
94
-
95
-
96
-
97
-
98
-
99
-
100
-
101
-
102
-
103
-
104
-
105
-
106
-
107
-
108
-
109
-
110
-
111
-
112
-
113
-
114
-
115
-
116
-
117
-
118
-
119
-
120
-
121
-
122
-
123
-
124
-
125
-
126
-
127
-
128
-
129
-
130
-
131
-
132
-
133
-
134
-
135
-
136
-
137
-
138
-
139
-
140
-
141
-
142
-
143
-
144
-
145
-
146
-
147
-
148
-
149
-
150
-
151
-
152
-
153
-
154
-
155
-
156
-
157
-
158
-
159
-
160
-
161
-
162
-
163
-
164
-
165
-
166
-
167
-
168
-
169
-
170
-
171
-
172
-
173
-
174
-
175
-
176
-
177
-
178
-
179
-
180
-
181
-
182
-
183
-
184
-
185
-
186
-
187
-
188
-
189
-
190
-
191
-
192
-
193
-
194
-
195
-
196
-
197
-
198
-
199
-
200
-
201
-
202
-
203
-
204
-
205
-
206
-
207
-
208
-
209
-
210
-
211
-
212
-
213
-
214
-
215
-
216
-
217
-
218
-
219
-
220
-
221
-
222
-
223
-
224
-
225
-
226
-
227
-
228
-
229
-
230
-
231
-
232
-
233
-
234
-
235
-
236
-
237
-
238
-
239
-
240
-
241
-
242
-
243
-
244
-
245
-
246
-
247
-
248
-
249
-
250
-
251
-
252
-
253
-
254
-
255
-
256
-
257
-
258
-
259
-
260
-
261
-
262
-
263
-
264
-
265
-
266
-
267
-
268
-
269
-
270
-
271
-
272
-
273
-
274
-
275
-
276
-
277
-
278
-
279
-
280
-
281
-
282
-
283
-
284
-
285
-
286
-
287
-
288
-
289
-
290
-
291
-
292
-
293
-
294
-
295
-
296
-
297
-
298
-
299
-
300
-
301
-
302
-
303
-
304
-
305
-
306
-
307
-
308
-
309
-
310
-
311
-
312
-
313
-
314
-
315
-
316
-
317
-
318
-
319
-
320
-
321
-
322
-
323
-
324
-
325
-
326
-
327
-
328
-
329
-
330
-
331
-
332
-
333
-
334
-
335
-
336
-
337
-
338
-
339
-
340
-
341
-
342
-
343
-
344
-
345
-
346
-
347
-
348
-
349
-
350
-
351
-
352
-
353
-
354
-
355
-
356
-
357
-
358
-
359
-
360
-
361
-
362
-
363
-
364
-
365
-
366
-
367
-
368
-
369
-
370
-
371
-
372
-
373
-
374
-
375
-
376
-
377
-
378
-
379
-
380
-
381
-
382
-
383
-
384
-
385
-
386
-
387
-
388
-
389
-
390
-
391
-
392
-
393
-
394
-
395
-
396
-
397
-
398
-
399
-
400
-
401
-
402
-
403
-
404
-
405
-
406
-
407
-
408
-
409
-
410
-
411
-
412
-
413
-
414
-
415
-
416
-
417
-
418
-
419
-
420
-
421
-
422
-
423
-
424
-
425
-
426
-
427
-
428
-
429
-
430
-
431
-
432
-
433
-
434
-
435
-
436
-
437
-
438
-
439
-
440
 |
 |

HSBC HOLDINGS PLC
Report of the Directors: Operating and Financial Review (continued)
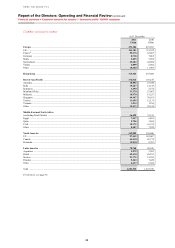
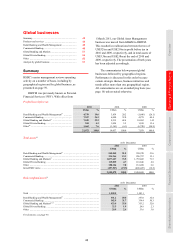
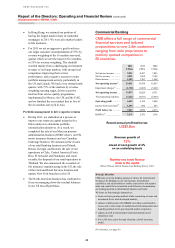
Global businesses > RBWM
46
Retail Banking and Wealth Management
RBWM provides banking and wealth
management services to individual
customers across our principal
geographic markets.
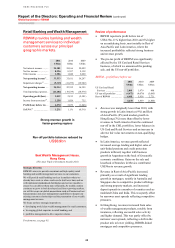
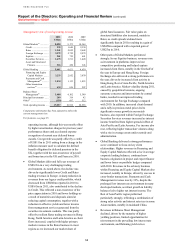
2011 2010 2009
US$m US$m US$m
Net interest income .......... 24,101 24,166 25,099
Net fee income ................. 8,226 8,397 9,138
Other income ................... 1,206 1,048 2,060
Net operating income52 ... 33,533 33,611 36,297
Impairment charges53 ....... (9,319) (11,259) (19,902)
Net operating income .... 24,214 22,352 16,395
Total operating expenses .. (21,202) (19,539) (18,976)
Operating profit/(loss) ... 3,012 2,813 (2,581)
Income from associates54 .. 1,258 1,026 735
Profit/(loss) before tax ... 4,270 3,839 (1,846)
RoRWA55 ......................... 1.2% 1.1% (0.5%)
Strong revenue growth in
faster-growing regions
Run-off portfolio balances reduced by
US$8.9bn
Best Wealth Management House,
Hong Kong
(The Asset Triple A Investment Awards 2011)
Strategic direction
RBWM’s aim is to provide consistent and high quality retail
banking and wealth management services to our customers.
We will provide retail banking services in markets where we
already have scale or where scale can be built over time and we
will implement standardised distribution and service models to
ensure we can deliver them more efficiently. As wealth creation
continues to grow in both developed and faster-growing markets,
we will leverage our global propositions such as Premier and our
bancassurance and asset management capabilities to deepen our
existing customer relationships and the penetration of our wealth
management services.
We focus on three strategic imperatives:
• developing world class wealth management for retail customers;
• leveraging global expertise in retail banking; and
• portfolio management to drive superior returns.
For footnotes, see page 95.
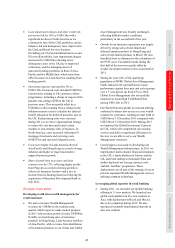
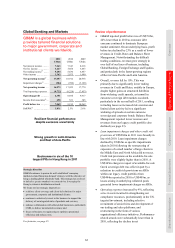
Review of performance
• RBWM reported a profit before tax of
US$4.3bn, 11% higher than 2010 and 6% higher
on an underlying basis, most notably in Rest of
Asia-Pacific and Latin America, where the
increased profitability reflected strong business
and revenue growth.
• The pre-tax profit of RBWM was significantly
affected by the US Card and Retail Services
business, of which we announced the pending
sale, and the US run-off portfolios.
RBWM – profit/(loss) before tax
2011 2010 2009
US$m US$m US$m
US Card and Retail
Services ........................... 2,061 1,979 498
US run-off portfolios ......... (4,472) (4,076) (5,065)
Rest of RBWM .................. 6,681 5,936 2,721
4,270 3,839 (1,846)
• Revenue was marginally lower than 2010, with
strong growth in Latin America (9%) and Rest
of Asia-Pacific (8%) and modest growth in
Hong Kong (3%) more than offset by lower
revenues in North America from the continued
run-off in the CML portfolios, lower balances in
US Card and Retail Services and an increase in
adverse fair value movements on non-qualifying
hedges.
• In Latin America, revenue growth reflected
increased average lending and higher sales of
unit-linked pensions and credit protection
products in Brazil, together with business
growth in Argentina on the back of favourable
economic conditions. Gains on the sale and
leaseback of branches in Mexico contributed
US$36m to revenue growth.
• Revenue in Rest of Asia-Pacific increased,
primarily as a result of significant lending
growth in mortgages, notably in Australia and
Singapore due to competitive product offerings
and strong property markets, and increased
deposit spreads in a number of countries such as
mainland China and India. This was partly offset
by narrower asset spreads reflecting competitive
pressures.
• In Hong Kong, revenues increased from sales
of wealth management products, notably from
insurance, reflecting successful sales activity
and higher demand. This was partly offset by
narrower asset spreads, reflecting a shift in the
product mix to lower yielding, HIBOR-linked
mortgages and competitive pressures.