HSBC 2011 Annual Report Download - page 377
Download and view the complete annual report
Please find page 377 of the 2011 HSBC annual report below. You can navigate through the pages in the report by either clicking on the pages listed below, or by using the keyword search tool below to find specific information within the annual report.-
 1
1 -
2
-
3
-
4
-
5
-
6
-
7
-
8
-
9
-
10
-
11
-
12
-
13
-
14
-
15
-
16
-
17
-
18
-
19
-
20
-
21
-
22
-
23
-
24
-
25
-
26
-
27
-
28
-
29
-
30
-
31
-
32
-
33
-
34
-
35
-
36
-
37
-
38
-
39
-
40
-
41
-
42
-
43
-
44
-
45
-
46
-
47
-
48
-
49
-
50
-
51
-
52
-
53
-
54
-
55
-
56
-
57
-
58
-
59
-
60
-
61
-
62
-
63
-
64
-
65
-
66
-
67
-
68
-
69
-
70
-
71
-
72
-
73
-
74
-
75
-
76
-
77
-
78
-
79
-
80
-
81
-
82
-
83
-
84
-
85
-
86
-
87
-
88
-
89
-
90
-
91
-
92
-
93
-
94
-
95
-
96
-
97
-
98
-
99
-
100
-
101
-
102
-
103
-
104
-
105
-
106
-
107
-
108
-
109
-
110
-
111
-
112
-
113
-
114
-
115
-
116
-
117
-
118
-
119
-
120
-
121
-
122
-
123
-
124
-
125
-
126
-
127
-
128
-
129
-
130
-
131
-
132
-
133
-
134
-
135
-
136
-
137
-
138
-
139
-
140
-
141
-
142
-
143
-
144
-
145
-
146
-
147
-
148
-
149
-
150
-
151
-
152
-
153
-
154
-
155
-
156
-
157
-
158
-
159
-
160
-
161
-
162
-
163
-
164
-
165
-
166
-
167
-
168
-
169
-
170
-
171
-
172
-
173
-
174
-
175
-
176
-
177
-
178
-
179
-
180
-
181
-
182
-
183
-
184
-
185
-
186
-
187
-
188
-
189
-
190
-
191
-
192
-
193
-
194
-
195
-
196
-
197
-
198
-
199
-
200
-
201
-
202
-
203
-
204
-
205
-
206
-
207
-
208
-
209
-
210
-
211
-
212
-
213
-
214
-
215
-
216
-
217
-
218
-
219
-
220
-
221
-
222
-
223
-
224
-
225
-
226
-
227
-
228
-
229
-
230
-
231
-
232
-
233
-
234
-
235
-
236
-
237
-
238
-
239
-
240
-
241
-
242
-
243
-
244
-
245
-
246
-
247
-
248
-
249
-
250
-
251
-
252
-
253
-
254
-
255
-
256
-
257
-
258
-
259
-
260
-
261
-
262
-
263
-
264
-
265
-
266
-
267
-
268
-
269
-
270
-
271
-
272
-
273
-
274
-
275
-
276
-
277
-
278
-
279
-
280
-
281
-
282
-
283
-
284
-
285
-
286
-
287
-
288
-
289
-
290
-
291
-
292
-
293
-
294
-
295
-
296
-
297
-
298
-
299
-
300
-
301
-
302
-
303
-
304
-
305
-
306
-
307
-
308
-
309
-
310
-
311
-
312
-
313
-
314
-
315
-
316
-
317
-
318
-
319
-
320
-
321
-
322
-
323
-
324
-
325
-
326
-
327
-
328
-
329
-
330
-
331
-
332
-
333
-
334
-
335
-
336
-
337
-
338
-
339
-
340
-
341
-
342
-
343
-
344
-
345
-
346
-
347
-
348
-
349
-
350
-
351
-
352
-
353
-
354
-
355
-
356
-
357
-
358
-
359
-
360
-
361
-
362
-
363
-
364
-
365
-
366
-
 367
367 -
 368
368 -
 369
369 -
 370
370 -
 371
371 -
 372
372 -
 373
373 -
 374
374 -
 375
375 -
 376
376 -
 377
377 -
 378
378 -
 379
379 -
 380
380 -
 381
381 -
 382
382 -
 383
383 -
 384
384 -
 385
385 -
 386
386 -
 387
387 -
388
-
389
-
390
-
391
-
392
-
393
-
394
-
395
-
396
-
397
-
398
-
399
-
400
-
401
-
402
-
403
-
404
-
405
-
406
-
407
-
408
-
409
-
410
-
411
-
412
-
413
-
414
-
415
-
416
-
417
-
418
-
419
-
420
-
421
-
422
-
423
-
424
-
425
-
426
-
427
-
428
-
429
-
430
-
431
-
432
-
433
-
434
-
435
-
436
-
437
-
438
-
439
-
440
 |
 |

375
Overview Operating & Financial Review Corporate Governance Financial Statements Shareholder Information
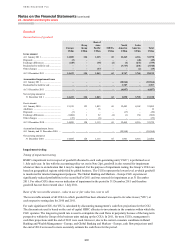
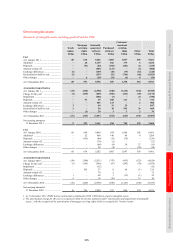
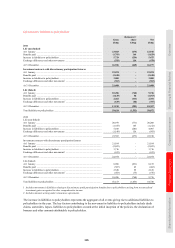
Other intangible assets
Movement of intangible assets excluding goodwill and the PVIF
Trade
names
Mortgage
servicing
rights
Internally
generated
software
Purchased
software
Customer/
merchant
relation-
ships Other Total
US$m US$m US$m US$m US$m US$m US$m
Cost
At 1 January 2011 ................................. 68 636 5,202 1,065 1,987 503 9,461
Additions1 ............................................. – 40 1,129 102 379 6 1,656
Disposals ............................................... – (91) (44) (102) (181) (1) (419)
Amount written off ............................... – – (365) (133) – (2) (500)
Exchange differences ............................ (6) – (109) (40) (79) (14) (248)
Reclassified to held for sale .................. (2) – (197) (22) (746) (46) (1,013)
Other changes ....................................... – 6 (18) (14) (6) 8 (24)
At 31 December 2011 ........................... 60 591 5,598 856 1,354 454 8,913
Accumulated amortisation
At 1 January 2011 ................................. (52) (240) (2,958) (848) (1,143) (144) (5,385)
Charge for the year2 .............................. (4) (215) (609) (106) (212) (29) (1,175)
Impairment ............................................ – – (386) (3) – (1) (390)
Disposals ............................................... – 91 29 100 111 3 334
Amount written off ............................... – – 365 133 – 2 500
Exchange differences ............................ 3 – 44 31 29 – 107
Reclassified to held for sale .................. 2 – 50 18 563 36 669
Other changes ....................................... – (5) 28 3 3 2 31
At 31 December 2011 ........................... (51) (369) (3,437) (672) (649) (131) (5,309)
Net carrying amount at
31 December 2011 ........................... 9 222 2,161 184 705 323 3,604
Cost
At 1 January 2010 ................................. 68 689 4,400 954 1,988 502 8,601
Additions1 ............................................. – 52 960 140 48 4 1,204
Disposals ............................................... – (105) (40) (15) (79) – (239)
Amount written off ............................... – – (70) (2) – – (72)
Exchange differences ............................ – – (68) (4) 30 27 (15)
Other changes ....................................... – – 20 (8) – (30) (18)
At 31 December 2010 ........................... 68 636 5,202 1,065 1,987 503 9,461
Accumulated amortisation
At 1 January 2010 ................................. (50) (240) (2,511) (747) (955) (125) (4,628)
Charge for the year2 .............................. (5) (105) (596) (97) (243) (30) (1,076)
Impairment ............................................ – – (12) – – – (12)
Disposals ............................................... – 105 33 8 68 (1) 213
Amount written off ............................... – – 70 2 – – 72
Exchange differences ............................ 1 – 48 1 (13) (1) 36
Other changes ....................................... 2 – 10 (15) – 13 10
At 31 December 2010 ........................... (52) (240) (2,958) (848) (1,143) (144) (5,385)
Net carrying amount at
31 December 2010 ........................... 16 396 2,244 217 844 359 4,076
1 At 31 December 2011, HSBC had no contractual commitments (2010: US$0.2m) to acquire intangible assets.
2 The amortisation charge for the year is recognised within the income statement under ‘Amortisation and impairment of intangible
assets’, with the exception of the amortisation of mortgage servicing rights which is recognised in ‘Net fee income’.