HSBC 2011 Annual Report Download - page 151
Download and view the complete annual report
Please find page 151 of the 2011 HSBC annual report below. You can navigate through the pages in the report by either clicking on the pages listed below, or by using the keyword search tool below to find specific information within the annual report.-
 1
1 -
2
-
3
-
4
-
5
-
6
-
7
-
8
-
9
-
10
-
11
-
12
-
13
-
14
-
15
-
16
-
17
-
18
-
19
-
20
-
21
-
22
-
23
-
24
-
25
-
26
-
27
-
28
-
29
-
30
-
31
-
32
-
33
-
34
-
35
-
36
-
37
-
38
-
39
-
40
-
41
-
42
-
43
-
44
-
45
-
46
-
47
-
48
-
49
-
50
-
51
-
52
-
53
-
54
-
55
-
56
-
57
-
58
-
59
-
60
-
61
-
62
-
63
-
64
-
65
-
66
-
67
-
68
-
69
-
70
-
71
-
72
-
73
-
74
-
75
-
76
-
77
-
78
-
79
-
80
-
81
-
82
-
83
-
84
-
85
-
86
-
87
-
88
-
89
-
90
-
91
-
92
-
93
-
94
-
95
-
96
-
97
-
98
-
99
-
100
-
101
-
102
-
103
-
104
-
105
-
106
-
107
-
108
-
109
-
110
-
111
-
112
-
113
-
114
-
115
-
116
-
117
-
118
-
119
-
120
-
121
-
122
-
123
-
124
-
125
-
126
-
127
-
128
-
129
-
130
-
131
-
132
-
133
-
134
-
135
-
136
-
137
-
138
-
139
-
140
-
 141
141 -
 142
142 -
 143
143 -
 144
144 -
 145
145 -
 146
146 -
 147
147 -
 148
148 -
 149
149 -
 150
150 -
 151
151 -
 152
152 -
 153
153 -
 154
154 -
 155
155 -
 156
156 -
 157
157 -
 158
158 -
 159
159 -
 160
160 -
 161
161 -
162
-
163
-
164
-
165
-
166
-
167
-
168
-
169
-
170
-
171
-
172
-
173
-
174
-
175
-
176
-
177
-
178
-
179
-
180
-
181
-
182
-
183
-
184
-
185
-
186
-
187
-
188
-
189
-
190
-
191
-
192
-
193
-
194
-
195
-
196
-
197
-
198
-
199
-
200
-
201
-
202
-
203
-
204
-
205
-
206
-
207
-
208
-
209
-
210
-
211
-
212
-
213
-
214
-
215
-
216
-
217
-
218
-
219
-
220
-
221
-
222
-
223
-
224
-
225
-
226
-
227
-
228
-
229
-
230
-
231
-
232
-
233
-
234
-
235
-
236
-
237
-
238
-
239
-
240
-
241
-
242
-
243
-
244
-
245
-
246
-
247
-
248
-
249
-
250
-
251
-
252
-
253
-
254
-
255
-
256
-
257
-
258
-
259
-
260
-
261
-
262
-
263
-
264
-
265
-
266
-
267
-
268
-
269
-
270
-
271
-
272
-
273
-
274
-
275
-
276
-
277
-
278
-
279
-
280
-
281
-
282
-
283
-
284
-
285
-
286
-
287
-
288
-
289
-
290
-
291
-
292
-
293
-
294
-
295
-
296
-
297
-
298
-
299
-
300
-
301
-
302
-
303
-
304
-
305
-
306
-
307
-
308
-
309
-
310
-
311
-
312
-
313
-
314
-
315
-
316
-
317
-
318
-
319
-
320
-
321
-
322
-
323
-
324
-
325
-
326
-
327
-
328
-
329
-
330
-
331
-
332
-
333
-
334
-
335
-
336
-
337
-
338
-
339
-
340
-
341
-
342
-
343
-
344
-
345
-
346
-
347
-
348
-
349
-
350
-
351
-
352
-
353
-
354
-
355
-
356
-
357
-
358
-
359
-
360
-
361
-
362
-
363
-
364
-
365
-
366
-
367
-
368
-
369
-
370
-
371
-
372
-
373
-
374
-
375
-
376
-
377
-
378
-
379
-
380
-
381
-
382
-
383
-
384
-
385
-
386
-
387
-
388
-
389
-
390
-
391
-
392
-
393
-
394
-
395
-
396
-
397
-
398
-
399
-
400
-
401
-
402
-
403
-
404
-
405
-
406
-
407
-
408
-
409
-
410
-
411
-
412
-
413
-
414
-
415
-
416
-
417
-
418
-
419
-
420
-
421
-
422
-
423
-
424
-
425
-
426
-
427
-
428
-
429
-
430
-
431
-
432
-
433
-
434
-
435
-
436
-
437
-
438
-
439
-
440
 |
 |

149
Overview Operating & Financial Review Corporate Governance Financial Statements Shareholder Information
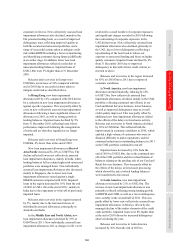
The credit quality of the loans and advances to
HSBC undertakings is assessed as strong/good, with
100% of the exposure being neither past due nor
impaired (2010: 100%). The credit ratings of the
financial investments held by HSBC Holdings are
within the S&P ratings range of A to A– (2010: A to
BBB+).
Securitisation exposures and other
structured products
(Audited)
This section contains information about our exposure
to the following:
• asset-backed securities (‘ABS’s), including
mortgage-backed securities (‘MBS’s) and
related collateralised debt obligations (‘CDO’s);
• direct lending at fair value through profit or
loss;
• monolines;
• credit derivative product companies;
• leveraged finance transactions; and
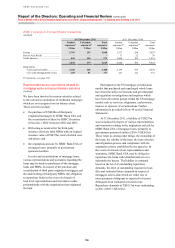
• representations and warranties related to
mortgage sales and securitisation activities.
Within the above is included information on the
GB&M legacy credit activities in respect of Solitaire
Funding Limited (‘Solitaire’), the securities
investment conduits (‘SIC’s), the asset-backed
securities trading portfolios and derivative
transactions with monoline insurers. Further
information in respect of Solitaire and the SICs is
provided in Note 43 to the Financial Statements.
Business model
(Unaudited)
MBSs and other ABSs are held in Balance Sheet
Management and as part of our investment portfolios
in order to earn net interest income and management
fees. Some are also held in the trading portfolio and
hedged through credit derivative protection with the
intention of earning the spread differential over the
life of the instruments.
Our investment portfolios include SICs and
money market funds, as described in Note 43 on the
Financial Statements. We also originate leveraged
finance loans for the purpose of syndicating or
selling them down to generate trading profit or
holding them to earn interest margin over their lives.
Accounting policies
Our accounting policies for the classification and valuation of
financial instruments are in accordance with the requirements
of IAS 32 ‘Financial Instruments: Presentation’ and IAS 39
‘Financial Instruments: Recognition and Measurement’, as
described in Note 2 on the Financial Statements, and the use of
assumptions and estimates in respect of the valuation of
financial instruments is described in Note 16 on the Financial
Statements.
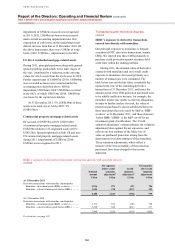
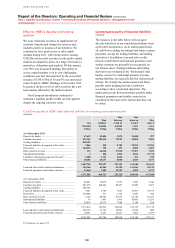
Exposure in 2011
(Audited)
2011 saw increased uncertainty and concerns around
sovereign credit risk, and a more pessimistic outlook
for the US housing market and, as a result, there was
no reoccurrence of the price appreciation across the
range of ABS asset classes seen in 2010. The level
of net write-downs to the income statement
increased to US$0.3bn (2010: no net write-downs).
However, unrealised losses in our available-for-sale
portfolios reduced in the year from US$6.4bn to
US$5.1bn, mainly as a result of price appreciation on
assets issued by US government agency and
sponsored enterprises and a reduction of the reserve
through impairments taken to the income statement.
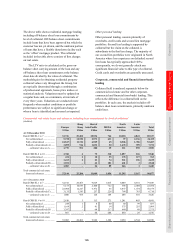
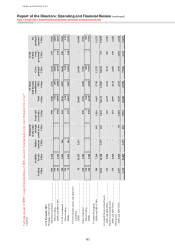
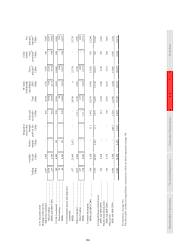
Within the following table are assets held in the
GB&M legacy credit portfolio with a carrying
value of US$35.4bn (2010: US$47.1bn).
A summary of the nature of HSBC’s
exposures is provided in the Appendix to Risk
on page 188.