HSBC 2011 Annual Report Download - page 36
Download and view the complete annual report
Please find page 36 of the 2011 HSBC annual report below. You can navigate through the pages in the report by either clicking on the pages listed below, or by using the keyword search tool below to find specific information within the annual report.-
 1
1 -
2
-
3
-
4
-
5
-
6
-
7
-
8
-
9
-
10
-
11
-
12
-
13
-
14
-
15
-
16
-
17
-
18
-
19
-
20
-
21
-
22
-
23
-
24
-
25
-
 26
26 -
 27
27 -
 28
28 -
 29
29 -
 30
30 -
 31
31 -
 32
32 -
 33
33 -
 34
34 -
 35
35 -
 36
36 -
 37
37 -
 38
38 -
 39
39 -
 40
40 -
 41
41 -
 42
42 -
 43
43 -
 44
44 -
 45
45 -
 46
46 -
47
-
48
-
49
-
50
-
51
-
52
-
53
-
54
-
55
-
56
-
57
-
58
-
59
-
60
-
61
-
62
-
63
-
64
-
65
-
66
-
67
-
68
-
69
-
70
-
71
-
72
-
73
-
74
-
75
-
76
-
77
-
78
-
79
-
80
-
81
-
82
-
83
-
84
-
85
-
86
-
87
-
88
-
89
-
90
-
91
-
92
-
93
-
94
-
95
-
96
-
97
-
98
-
99
-
100
-
101
-
102
-
103
-
104
-
105
-
106
-
107
-
108
-
109
-
110
-
111
-
112
-
113
-
114
-
115
-
116
-
117
-
118
-
119
-
120
-
121
-
122
-
123
-
124
-
125
-
126
-
127
-
128
-
129
-
130
-
131
-
132
-
133
-
134
-
135
-
136
-
137
-
138
-
139
-
140
-
141
-
142
-
143
-
144
-
145
-
146
-
147
-
148
-
149
-
150
-
151
-
152
-
153
-
154
-
155
-
156
-
157
-
158
-
159
-
160
-
161
-
162
-
163
-
164
-
165
-
166
-
167
-
168
-
169
-
170
-
171
-
172
-
173
-
174
-
175
-
176
-
177
-
178
-
179
-
180
-
181
-
182
-
183
-
184
-
185
-
186
-
187
-
188
-
189
-
190
-
191
-
192
-
193
-
194
-
195
-
196
-
197
-
198
-
199
-
200
-
201
-
202
-
203
-
204
-
205
-
206
-
207
-
208
-
209
-
210
-
211
-
212
-
213
-
214
-
215
-
216
-
217
-
218
-
219
-
220
-
221
-
222
-
223
-
224
-
225
-
226
-
227
-
228
-
229
-
230
-
231
-
232
-
233
-
234
-
235
-
236
-
237
-
238
-
239
-
240
-
241
-
242
-
243
-
244
-
245
-
246
-
247
-
248
-
249
-
250
-
251
-
252
-
253
-
254
-
255
-
256
-
257
-
258
-
259
-
260
-
261
-
262
-
263
-
264
-
265
-
266
-
267
-
268
-
269
-
270
-
271
-
272
-
273
-
274
-
275
-
276
-
277
-
278
-
279
-
280
-
281
-
282
-
283
-
284
-
285
-
286
-
287
-
288
-
289
-
290
-
291
-
292
-
293
-
294
-
295
-
296
-
297
-
298
-
299
-
300
-
301
-
302
-
303
-
304
-
305
-
306
-
307
-
308
-
309
-
310
-
311
-
312
-
313
-
314
-
315
-
316
-
317
-
318
-
319
-
320
-
321
-
322
-
323
-
324
-
325
-
326
-
327
-
328
-
329
-
330
-
331
-
332
-
333
-
334
-
335
-
336
-
337
-
338
-
339
-
340
-
341
-
342
-
343
-
344
-
345
-
346
-
347
-
348
-
349
-
350
-
351
-
352
-
353
-
354
-
355
-
356
-
357
-
358
-
359
-
360
-
361
-
362
-
363
-
364
-
365
-
366
-
367
-
368
-
369
-
370
-
371
-
372
-
373
-
374
-
375
-
376
-
377
-
378
-
379
-
380
-
381
-
382
-
383
-
384
-
385
-
386
-
387
-
388
-
389
-
390
-
391
-
392
-
393
-
394
-
395
-
396
-
397
-
398
-
399
-
400
-
401
-
402
-
403
-
404
-
405
-
406
-
407
-
408
-
409
-
410
-
411
-
412
-
413
-
414
-
415
-
416
-
417
-
418
-
419
-
420
-
421
-
422
-
423
-
424
-
425
-
426
-
427
-
428
-
429
-
430
-
431
-
432
-
433
-
434
-
435
-
436
-
437
-
438
-
439
-
440
 |
 |

HSBC HOLDINGS PLC
Report of the Directors: Operating and Financial Review (continued)
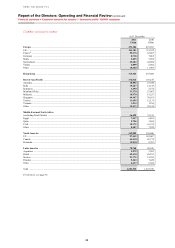
Financial summary > Consolidated balance sheet
34
Other assets, which, for the purpose of this
commentary, includes assets held for sale, increased
by 34%, reflecting the reclassification of assets of
disposal groups, most notably the loans and
advances to customers associated with the non-
strategic US branches and our Cards and Retail
Services business.
Liabilities
Deposits by banks rose by 4% due to higher
placements by other financial institutions with
HSBC, primarily in Rest of Asia-Pacific and North
America. This was partly offset by a reduction in
repo balances as a result of lower market activity.
Customer accounts increased by 4% in highly
competitive markets. This was driven by customer
acquisition, coupled with targeted deposit gathering
campaigns to support growth in lending, most
notably in Hong Kong, Rest of Asia-Pacific and in
Europe. This was partly offset by the reclassification
of deposits of businesses, principally the US
branches, to liabilities held-for-sale. Repo balances
in Europe also declined, reflecting lower market
activity levels, particularly during the latter part of
the year.
Trading liabilities fell by 11%. Net short bond
and equity positions decreased in line with the
reduction in holdings of debt and equity securities,
which fell as a result of lower market activity. Repo
balances also declined, reflecting lower funding
requirements as trading assets fell. These declines
were offset in part by a rise in cash collateral posted
by external counterparties in line with the increase in
the fair value of derivative contracts, notably in
Europe.
Financial liabilities designated at fair value
were broadly in line with 2010. Debt issuances by
HSBC entities in Europe were partly offset by
maturities not being replaced in North America as
funding requirements reduced in line with the
decline in the consumer finance portfolios in run-off.
Improved netting of non-recourse liabilities and
associated assets led to a further reduction in
‘Financial liabilities designated at fair value’, with a
corresponding decrease in ‘Financial assets
designated at fair value’.
Derivative businesses are managed within
market risk limits and, as a consequence, the
increase in the value of Derivative liabilities broadly
matched that of ‘Derivative assets’.
Debt securities in issue declined by 9%,
reflecting the non-replacement of maturing securities
in both North America and Europe as a result of
lower funding requirements relating to the continued
reduction in consumer lending balances and the
decline in trading assets, respectively. This was
offset in part by new issuances in Latin America and
Rest of Asia-Pacific to support balance sheet growth.
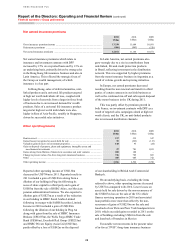
Liabilities under insurance contracts grew by
7%, driven by reserves established for new business
premiums written, notably in Hong Kong, Brazil,
France, the UK and Singapore. This was partly offset
by the effect of a fall in equity markets, which
resulted in a decline in the fair value of assets held to
support unit-linked and investment and insurance
contracts with DPF and also in the related liabilities
to policyholders, together with reductions due to the
non-renewal and transfer to third parties of certain
contracts in our Irish businesses and the sale of the
motor insurance business in the UK during 2011.
Other liabilities, which, for the purpose of this
commentary, includes liabilities of disposal groups,
increased by 24% as a result of the reclassification of
liabilities of businesses held for sale.
Equity
Total shareholders’ equity increased by 9%, driven
by profits generated during the year. In addition, the
negative balance on the available-for-sale reserve
declined from US$4.1bn at 31 December 2010 to
US$3.4bn at 31 December 2011, reflecting an
improvement in the market value of assets.