HSBC 2011 Annual Report Download - page 404
Download and view the complete annual report
Please find page 404 of the 2011 HSBC annual report below. You can navigate through the pages in the report by either clicking on the pages listed below, or by using the keyword search tool below to find specific information within the annual report.-
 1
1 -
2
-
3
-
4
-
5
-
6
-
7
-
8
-
9
-
10
-
11
-
12
-
13
-
14
-
15
-
16
-
17
-
18
-
19
-
20
-
21
-
22
-
23
-
24
-
25
-
26
-
27
-
28
-
29
-
30
-
31
-
32
-
33
-
34
-
35
-
36
-
37
-
38
-
39
-
40
-
41
-
42
-
43
-
44
-
45
-
46
-
47
-
48
-
49
-
50
-
51
-
52
-
53
-
54
-
55
-
56
-
57
-
58
-
59
-
60
-
61
-
62
-
63
-
64
-
65
-
66
-
67
-
68
-
69
-
70
-
71
-
72
-
73
-
74
-
75
-
76
-
77
-
78
-
79
-
80
-
81
-
82
-
83
-
84
-
85
-
86
-
87
-
88
-
89
-
90
-
91
-
92
-
93
-
94
-
95
-
96
-
97
-
98
-
99
-
100
-
101
-
102
-
103
-
104
-
105
-
106
-
107
-
108
-
109
-
110
-
111
-
112
-
113
-
114
-
115
-
116
-
117
-
118
-
119
-
120
-
121
-
122
-
123
-
124
-
125
-
126
-
127
-
128
-
129
-
130
-
131
-
132
-
133
-
134
-
135
-
136
-
137
-
138
-
139
-
140
-
141
-
142
-
143
-
144
-
145
-
146
-
147
-
148
-
149
-
150
-
151
-
152
-
153
-
154
-
155
-
156
-
157
-
158
-
159
-
160
-
161
-
162
-
163
-
164
-
165
-
166
-
167
-
168
-
169
-
170
-
171
-
172
-
173
-
174
-
175
-
176
-
177
-
178
-
179
-
180
-
181
-
182
-
183
-
184
-
185
-
186
-
187
-
188
-
189
-
190
-
191
-
192
-
193
-
194
-
195
-
196
-
197
-
198
-
199
-
200
-
201
-
202
-
203
-
204
-
205
-
206
-
207
-
208
-
209
-
210
-
211
-
212
-
213
-
214
-
215
-
216
-
217
-
218
-
219
-
220
-
221
-
222
-
223
-
224
-
225
-
226
-
227
-
228
-
229
-
230
-
231
-
232
-
233
-
234
-
235
-
236
-
237
-
238
-
239
-
240
-
241
-
242
-
243
-
244
-
245
-
246
-
247
-
248
-
249
-
250
-
251
-
252
-
253
-
254
-
255
-
256
-
257
-
258
-
259
-
260
-
261
-
262
-
263
-
264
-
265
-
266
-
267
-
268
-
269
-
270
-
271
-
272
-
273
-
274
-
275
-
276
-
277
-
278
-
279
-
280
-
281
-
282
-
283
-
284
-
285
-
286
-
287
-
288
-
289
-
290
-
291
-
292
-
293
-
294
-
295
-
296
-
297
-
298
-
299
-
300
-
301
-
302
-
303
-
304
-
305
-
306
-
307
-
308
-
309
-
310
-
311
-
312
-
313
-
314
-
315
-
316
-
317
-
318
-
319
-
320
-
321
-
322
-
323
-
324
-
325
-
326
-
327
-
328
-
329
-
330
-
331
-
332
-
333
-
334
-
335
-
336
-
337
-
338
-
339
-
340
-
341
-
342
-
343
-
344
-
345
-
346
-
347
-
348
-
349
-
350
-
351
-
352
-
353
-
354
-
355
-
356
-
357
-
358
-
359
-
360
-
361
-
362
-
363
-
364
-
365
-
366
-
367
-
368
-
369
-
370
-
371
-
372
-
373
-
374
-
375
-
376
-
377
-
378
-
379
-
380
-
381
-
382
-
383
-
384
-
385
-
386
-
387
-
388
-
389
-
390
-
391
-
392
-
393
-
 394
394 -
 395
395 -
 396
396 -
 397
397 -
 398
398 -
 399
399 -
 400
400 -
 401
401 -
 402
402 -
 403
403 -
 404
404 -
 405
405 -
 406
406 -
 407
407 -
 408
408 -
 409
409 -
 410
410 -
 411
411 -
 412
412 -
 413
413 -
 414
414 -
415
-
416
-
417
-
418
-
419
-
420
-
421
-
422
-
423
-
424
-
425
-
426
-
427
-
428
-
429
-
430
-
431
-
432
-
433
-
434
-
435
-
436
-
437
-
438
-
439
-
440
 |
 |

HSBC HOLDINGS PLC
Notes on the Financial Statements (continued)
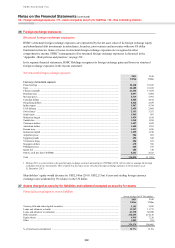
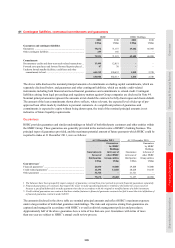
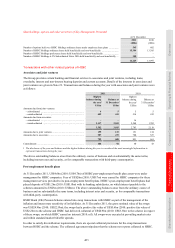
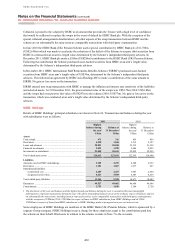
43 – Special purpose entities
402
Total consolidated assets held by SPEs by balance sheet classification
Conduits
Securit-
isations
Money
market
funds
Non-money
market
investment
funds Total
US$bn US$bn US$bn US$bn US$bn
At 31 December 2011
Cash ...................................................................................... 0.8 0.3 – 0.3 1.4
Trading assets ....................................................................... 0.1 0.5 0.2 0.4 1.2
Financial assets designated at fair value ............................... 0.1 – – 6.5 6.6
Derivatives ............................................................................ – 0.1 – – 0.1
Loans and advances to banks ............................................... – 1.2 – – 1.2
Loans and advances to customers ........................................ 10.5 8.0 – – 18.5
Financial investments ........................................................... 25.8 – – – 25.8
Other assets ........................................................................... 1.6 – – – 1.6
38.9 10.1 0.2 7.2 56.4
At 31 December 2010
Cash ...................................................................................... 1.0 0.7 – 0.3 2.0
Trading assets ....................................................................... 0.1 0.6 0.4 0.5 1.6
Financial assets designated at fair value .............................. 0.1 – – 6.4 6.5
Derivatives ............................................................................ – 0.3 – – 0.3
Loans and advances to banks ............................................... – 1.4 – – 1.4
Loans and advances to customers ........................................ 8.4 22.2 – – 30.6
Financial investments ........................................................... 30.5 0.1 – – 30.6
Other assets ........................................................................... 1.6 0.4 – 0.4 2.4
41.7 25.7 0.4 7.6 75.4
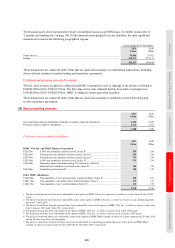
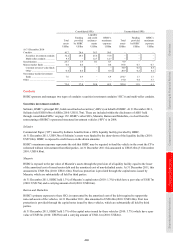
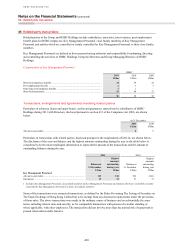
HSBC’s maximum exposure to SPEs
The following table shows the total assets of the various types of SPEs and the amount of funding provided by HSBC
to these SPEs. The table also shows HSBC’s maximum exposure to the SPEs and, within that exposure, the liquidity
and credit enhancements provided by HSBC. The maximum exposures to SPEs represent HSBC’s maximum possible
risk exposure that could occur as a result of the Group’s arrangements and commitments to SPEs. The maximum
amounts are contingent in nature, and may arise as a result of drawdowns under liquidity facilities, where these have
been provided, and any other funding commitments, or as a result of any loss protection provided by HSBC to the
SPEs. The conditions under which such exposure might arise differ depending on the nature of each SPE and
HSBC’s involvement with it.
Total assets of consolidated and unconsolidated SPEs and HSBC’s funding and maximum exposure
Consolidated SPEs Unconsolidated SPEs
Total
assets
Funding
provided
by HSBC
Liquidity
and credit
enchance-
ments
HSBC’s
maximum
exposure
Total
assets
Funding
provided
by HSBC
HSBC’s
maximum
exposure
US$bn US$bn US$bn US$bn US$bn US$bn US$bn
At 31 December 2011
Conduits ...................................... 38.9 27.7 37.1 48.5 – – –
Securities investment conduits 27.9 27.4 22.1 33.5 – – –
Multi-seller conduits .............. 11.0 0.3 15.0 15.0 – – –
Securitisations ................................ 10.1 1.6 0.1 3.8 8.1 – –
Money market funds ................... 0.2 0.2 – 0.2 73.9 0.9 0.9
Constant net asset value funds – – – –54.4 0.7 0.7
Other ....................................... 0.2 0.2 – 0.2 19.5 0.2 0.2
Non-money market investment
funds ....................................... 7.2 6.9 – 6.9 260.8 1.7 1.7
Other ........................................... – – – – 19.4 3.7 4.6
56.4 36.4 37.2 59.4 362.2 6.3 7.2