HSBC 2011 Annual Report Download - page 373
Download and view the complete annual report
Please find page 373 of the 2011 HSBC annual report below. You can navigate through the pages in the report by either clicking on the pages listed below, or by using the keyword search tool below to find specific information within the annual report.-
 1
1 -
2
-
3
-
4
-
5
-
6
-
7
-
8
-
9
-
10
-
11
-
12
-
13
-
14
-
15
-
16
-
17
-
18
-
19
-
20
-
21
-
22
-
23
-
24
-
25
-
26
-
27
-
28
-
29
-
30
-
31
-
32
-
33
-
34
-
35
-
36
-
37
-
38
-
39
-
40
-
41
-
42
-
43
-
44
-
45
-
46
-
47
-
48
-
49
-
50
-
51
-
52
-
53
-
54
-
55
-
56
-
57
-
58
-
59
-
60
-
61
-
62
-
63
-
64
-
65
-
66
-
67
-
68
-
69
-
70
-
71
-
72
-
73
-
74
-
75
-
76
-
77
-
78
-
79
-
80
-
81
-
82
-
83
-
84
-
85
-
86
-
87
-
88
-
89
-
90
-
91
-
92
-
93
-
94
-
95
-
96
-
97
-
98
-
99
-
100
-
101
-
102
-
103
-
104
-
105
-
106
-
107
-
108
-
109
-
110
-
111
-
112
-
113
-
114
-
115
-
116
-
117
-
118
-
119
-
120
-
121
-
122
-
123
-
124
-
125
-
126
-
127
-
128
-
129
-
130
-
131
-
132
-
133
-
134
-
135
-
136
-
137
-
138
-
139
-
140
-
141
-
142
-
143
-
144
-
145
-
146
-
147
-
148
-
149
-
150
-
151
-
152
-
153
-
154
-
155
-
156
-
157
-
158
-
159
-
160
-
161
-
162
-
163
-
164
-
165
-
166
-
167
-
168
-
169
-
170
-
171
-
172
-
173
-
174
-
175
-
176
-
177
-
178
-
179
-
180
-
181
-
182
-
183
-
184
-
185
-
186
-
187
-
188
-
189
-
190
-
191
-
192
-
193
-
194
-
195
-
196
-
197
-
198
-
199
-
200
-
201
-
202
-
203
-
204
-
205
-
206
-
207
-
208
-
209
-
210
-
211
-
212
-
213
-
214
-
215
-
216
-
217
-
218
-
219
-
220
-
221
-
222
-
223
-
224
-
225
-
226
-
227
-
228
-
229
-
230
-
231
-
232
-
233
-
234
-
235
-
236
-
237
-
238
-
239
-
240
-
241
-
242
-
243
-
244
-
245
-
246
-
247
-
248
-
249
-
250
-
251
-
252
-
253
-
254
-
255
-
256
-
257
-
258
-
259
-
260
-
261
-
262
-
263
-
264
-
265
-
266
-
267
-
268
-
269
-
270
-
271
-
272
-
273
-
274
-
275
-
276
-
277
-
278
-
279
-
280
-
281
-
282
-
283
-
284
-
285
-
286
-
287
-
288
-
289
-
290
-
291
-
292
-
293
-
294
-
295
-
296
-
297
-
298
-
299
-
300
-
301
-
302
-
303
-
304
-
305
-
306
-
307
-
308
-
309
-
310
-
311
-
312
-
313
-
314
-
315
-
316
-
317
-
318
-
319
-
320
-
321
-
322
-
323
-
324
-
325
-
326
-
327
-
328
-
329
-
330
-
331
-
332
-
333
-
334
-
335
-
336
-
337
-
338
-
339
-
340
-
341
-
342
-
343
-
344
-
345
-
346
-
347
-
348
-
349
-
350
-
351
-
352
-
353
-
354
-
355
-
356
-
357
-
358
-
359
-
360
-
361
-
362
-
 363
363 -
 364
364 -
 365
365 -
 366
366 -
 367
367 -
 368
368 -
 369
369 -
 370
370 -
 371
371 -
 372
372 -
 373
373 -
 374
374 -
 375
375 -
 376
376 -
 377
377 -
 378
378 -
 379
379 -
 380
380 -
 381
381 -
 382
382 -
 383
383 -
384
-
385
-
386
-
387
-
388
-
389
-
390
-
391
-
392
-
393
-
394
-
395
-
396
-
397
-
398
-
399
-
400
-
401
-
402
-
403
-
404
-
405
-
406
-
407
-
408
-
409
-
410
-
411
-
412
-
413
-
414
-
415
-
416
-
417
-
418
-
419
-
420
-
421
-
422
-
423
-
424
-
425
-
426
-
427
-
428
-
429
-
430
-
431
-
432
-
433
-
434
-
435
-
436
-
437
-
438
-
439
-
440
 |
 |

371
Overview Operating & Financial Review Corporate Governance Financial Statements Shareholder Information
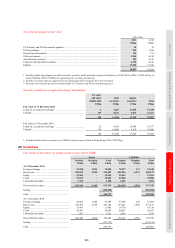
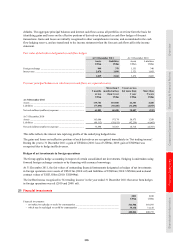
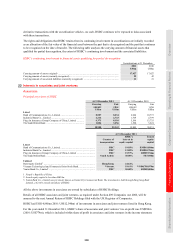
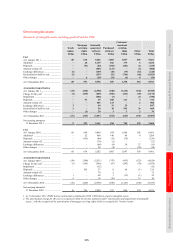
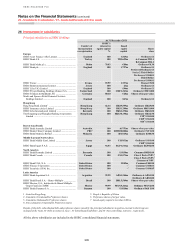
Summarised aggregate financial information on joint ventures
2011 2010
US$m US$m
HSBC’s share of:
– current assets ..................................................................................................................................... 1,556 1,481
– non-current assets .............................................................................................................................. 196 97
– current liabilities ................................................................................................................................ 747 706
– non-current liabilities ........................................................................................................................ 715 666
– income ............................................................................................................................................... 383 366
– expenses ............................................................................................................................................. 339 328
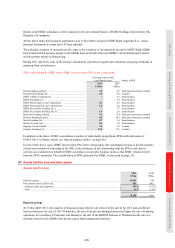
In December 2011, following the issue of shares by HSBC Saudi Arabia Limited to a third party, HSBC’s holding
was diluted from 60% to 49% and a dilution gain of US$27m was recognised in ‘Other operating income’.
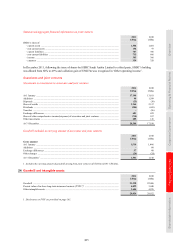
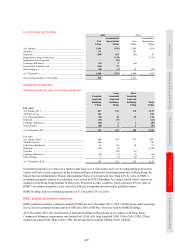
Associates and joint ventures
Movements in investments in associates and joint ventures
2011 2010
US$m US$m
At 1 January .............................................................................................................................................. 17,198 13,011
Additions .................................................................................................................................................. 90 1,589
Disposals ................................................................................................................................................... (25) (38)
Share of results ......................................................................................................................................... 3,264 2,517
Dividends .................................................................................................................................................. (304) (441)
Transfers ................................................................................................................................................... – (96)
Exchange differences ................................................................................................................................ 681 423
Share of other comprehensive income/(expense) of associates and joint ventures ................................. (710) 107
Other movements ...................................................................................................................................... 205 126
At 31 December ........................................................................................................................................ 20,399 17,198
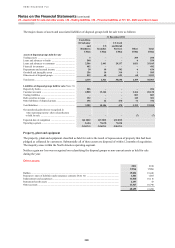
Goodwill included in carrying amount of associates and joint ventures
2011 2010
US$m US$m
Gross amount
At 1 January .............................................................................................................................................. 1,518 1,446
Additions .................................................................................................................................................. – 60
Exchange differences ................................................................................................................................ 57 40
Other changes ........................................................................................................................................... (24) (28)
At 31 December1 ....................................................................................................................................... 1,551 1,518
1 Includes the carrying amount of goodwill arising from joint ventures of US$31m (2010: US$32m).
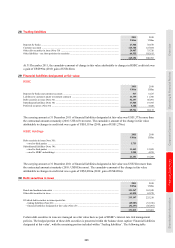
24 Goodwill and intangible assets
2011 2010
US$m US$m
Goodwill ................................................................................................................................................... 21,338 22,406
Present value of in-force long-term insurance business (‘PVIF’)1 .......................................................... 4,092 3,440
Other intangible assets .............................................................................................................................. 3,604 4,076
29,034 29,922
1 Disclosures on PVIF are provided on page 181.