HSBC 2011 Annual Report Download - page 25
Download and view the complete annual report
Please find page 25 of the 2011 HSBC annual report below. You can navigate through the pages in the report by either clicking on the pages listed below, or by using the keyword search tool below to find specific information within the annual report.-
 1
1 -
2
-
3
-
4
-
5
-
6
-
7
-
8
-
9
-
10
-
11
-
12
-
13
-
14
-
 15
15 -
 16
16 -
 17
17 -
 18
18 -
 19
19 -
 20
20 -
 21
21 -
 22
22 -
 23
23 -
 24
24 -
 25
25 -
 26
26 -
 27
27 -
 28
28 -
 29
29 -
 30
30 -
 31
31 -
 32
32 -
 33
33 -
 34
34 -
 35
35 -
36
-
37
-
38
-
39
-
40
-
41
-
42
-
43
-
44
-
45
-
46
-
47
-
48
-
49
-
50
-
51
-
52
-
53
-
54
-
55
-
56
-
57
-
58
-
59
-
60
-
61
-
62
-
63
-
64
-
65
-
66
-
67
-
68
-
69
-
70
-
71
-
72
-
73
-
74
-
75
-
76
-
77
-
78
-
79
-
80
-
81
-
82
-
83
-
84
-
85
-
86
-
87
-
88
-
89
-
90
-
91
-
92
-
93
-
94
-
95
-
96
-
97
-
98
-
99
-
100
-
101
-
102
-
103
-
104
-
105
-
106
-
107
-
108
-
109
-
110
-
111
-
112
-
113
-
114
-
115
-
116
-
117
-
118
-
119
-
120
-
121
-
122
-
123
-
124
-
125
-
126
-
127
-
128
-
129
-
130
-
131
-
132
-
133
-
134
-
135
-
136
-
137
-
138
-
139
-
140
-
141
-
142
-
143
-
144
-
145
-
146
-
147
-
148
-
149
-
150
-
151
-
152
-
153
-
154
-
155
-
156
-
157
-
158
-
159
-
160
-
161
-
162
-
163
-
164
-
165
-
166
-
167
-
168
-
169
-
170
-
171
-
172
-
173
-
174
-
175
-
176
-
177
-
178
-
179
-
180
-
181
-
182
-
183
-
184
-
185
-
186
-
187
-
188
-
189
-
190
-
191
-
192
-
193
-
194
-
195
-
196
-
197
-
198
-
199
-
200
-
201
-
202
-
203
-
204
-
205
-
206
-
207
-
208
-
209
-
210
-
211
-
212
-
213
-
214
-
215
-
216
-
217
-
218
-
219
-
220
-
221
-
222
-
223
-
224
-
225
-
226
-
227
-
228
-
229
-
230
-
231
-
232
-
233
-
234
-
235
-
236
-
237
-
238
-
239
-
240
-
241
-
242
-
243
-
244
-
245
-
246
-
247
-
248
-
249
-
250
-
251
-
252
-
253
-
254
-
255
-
256
-
257
-
258
-
259
-
260
-
261
-
262
-
263
-
264
-
265
-
266
-
267
-
268
-
269
-
270
-
271
-
272
-
273
-
274
-
275
-
276
-
277
-
278
-
279
-
280
-
281
-
282
-
283
-
284
-
285
-
286
-
287
-
288
-
289
-
290
-
291
-
292
-
293
-
294
-
295
-
296
-
297
-
298
-
299
-
300
-
301
-
302
-
303
-
304
-
305
-
306
-
307
-
308
-
309
-
310
-
311
-
312
-
313
-
314
-
315
-
316
-
317
-
318
-
319
-
320
-
321
-
322
-
323
-
324
-
325
-
326
-
327
-
328
-
329
-
330
-
331
-
332
-
333
-
334
-
335
-
336
-
337
-
338
-
339
-
340
-
341
-
342
-
343
-
344
-
345
-
346
-
347
-
348
-
349
-
350
-
351
-
352
-
353
-
354
-
355
-
356
-
357
-
358
-
359
-
360
-
361
-
362
-
363
-
364
-
365
-
366
-
367
-
368
-
369
-
370
-
371
-
372
-
373
-
374
-
375
-
376
-
377
-
378
-
379
-
380
-
381
-
382
-
383
-
384
-
385
-
386
-
387
-
388
-
389
-
390
-
391
-
392
-
393
-
394
-
395
-
396
-
397
-
398
-
399
-
400
-
401
-
402
-
403
-
404
-
405
-
406
-
407
-
408
-
409
-
410
-
411
-
412
-
413
-
414
-
415
-
416
-
417
-
418
-
419
-
420
-
421
-
422
-
423
-
424
-
425
-
426
-
427
-
428
-
429
-
430
-
431
-
432
-
433
-
434
-
435
-
436
-
437
-
438
-
439
-
440
 |
 |

23
Overview Operating & Financial Review Corporate Governance Financial Statements Shareholder Information
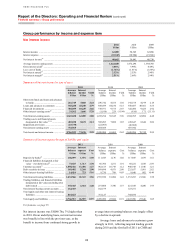
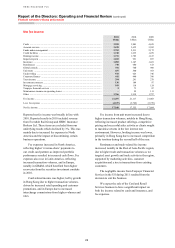
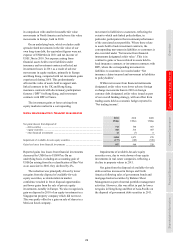
Net trading income
2011
US$m
2010
US$m
2009
US$m
Trading activities ........................................................................................................ 4,873 5,708 5,312
Net interest income on trading activities .................................................................... 3,223 2,530 3,627
Other trading income – hedge ineffectiveness:
– on cash flow hedges ............................................................................................ 26 (9) 90
– on fair value hedges ............................................................................................ (224) 38 (45)
Non-qualifying hedges ............................................................................................... (1,392) (1,057) 951
Losses on Bernard L Madoff Investment Securities LLC fraud ................................ – – (72)
Net trading income32,33 ................................................................................................ 6,506 7,210 9,863
For footnotes, see page 95.
Reported net trading income was US$6.5bn, 10%
lower than in 2010. On an underlying basis, net
trading income declined by 15%, driven by
significantly lower net income from trading activities
in GB&M as turmoil in eurozone sovereign debt
markets escalated, particularly in the second half
of 2011. Increased risk aversion and limited client
activity led to a significant widening of spreads on
certain eurozone sovereign and corporate bonds,
resulting in trading losses in our European Credit and
Rates businesses.
Net trading income also declined from our
legacy credit portfolio, a separately identifiable,
discretely managed business comprising Solitaire
Funding Limited, the securities investment conduits,
the asset-backed securities trading portfolios and
credit correlation portfolios, derivative transactions
entered into directly with monoline insurers, and
certain other structured credit transactions. This
reflected the non-recurrence of the price appreciation
during the previous year and lower holdings as a
result of maturities and disposals aimed at reducing
capital consumption, coupled with the non-
recurrence of an US$89m gain from a 2010 legal
settlement relating to certain loans previously
purchased for resale from a third party.
In addition, lower favourable foreign exchange
movements were reported on trading assets held as
economic hedges of foreign currency debt designated
at fair value. These offset lower adverse foreign
exchange movements on the foreign currency debt
which are reported in ‘Net expense from financial
instruments designated at fair value’.
Notwithstanding the difficult trading conditions,
there were strong performances across other parts
of GB&M. Rates trading revenues in Hong Kong,
North America and Latin America remained resilient
as client flows increased. Fair value gains on
structured liabilities also increased, mainly in Rates,
as credit spreads widened more significantly than in
2010, resulting in a gain of US$458m compared with
US$23m in 2010.
Our Foreign Exchange business benefited from
increased activity from both Global Banking and
CMB customers, particularly in Hong Kong, Rest
of Asia-Pacific, North America and Latin America,
coupled with an improved trading environment
compared with 2010. The latter reflected market
volatility caused by geopolitical tensions, ongoing
eurozone sovereign debt concerns and interventions
by central banks. Equities revenues also rose as
investment in platforms improved our competitive
positioning and helped capture increased client
flows, notably in the first half of the year in Europe
and Hong Kong.
In addition to the decline in net income from
trading activities in GB&M, we reported adverse fair
value movements on derivatives relating to certain
legacy provident funds in Hong Kong as long-term
investment returns fell. This was offset in part by a
reduction in the loss provisions for mortgage loan
repurchase obligations associated with loans
previously sold in RBWM in North America, which
decreased by US$341m to US$92m.
There were adverse fair value movements on
non-qualifying hedges. These are derivatives
entered into as part of a documented interest rate
management strategy for which hedge accounting
was not, or could not be, applied. They are
principally cross-currency and interest rate swaps
used to economically hedge fixed rate debt issued
by HSBC Holdings and floating rate debt issued by
HSBC Finance. The size and direction of the changes
in fair value of non-qualifying hedges that are
recognised in the income statement can be volatile
from year to year, but do not alter the cash flows
expected as part of the documented interest rate
management strategy for both the instruments and
the underlying economically hedged assets and
liabilities. The adverse fair value movement on non-
qualifying hedges in North America was higher in
2011 as long-term US interest rates declined to a
greater extent than in 2010. This was partly offset by