HSBC 2011 Annual Report Download - page 343
Download and view the complete annual report
Please find page 343 of the 2011 HSBC annual report below. You can navigate through the pages in the report by either clicking on the pages listed below, or by using the keyword search tool below to find specific information within the annual report.-
 1
1 -
2
-
3
-
4
-
5
-
6
-
7
-
8
-
9
-
10
-
11
-
12
-
13
-
14
-
15
-
16
-
17
-
18
-
19
-
20
-
21
-
22
-
23
-
24
-
25
-
26
-
27
-
28
-
29
-
30
-
31
-
32
-
33
-
34
-
35
-
36
-
37
-
38
-
39
-
40
-
41
-
42
-
43
-
44
-
45
-
46
-
47
-
48
-
49
-
50
-
51
-
52
-
53
-
54
-
55
-
56
-
57
-
58
-
59
-
60
-
61
-
62
-
63
-
64
-
65
-
66
-
67
-
68
-
69
-
70
-
71
-
72
-
73
-
74
-
75
-
76
-
77
-
78
-
79
-
80
-
81
-
82
-
83
-
84
-
85
-
86
-
87
-
88
-
89
-
90
-
91
-
92
-
93
-
94
-
95
-
96
-
97
-
98
-
99
-
100
-
101
-
102
-
103
-
104
-
105
-
106
-
107
-
108
-
109
-
110
-
111
-
112
-
113
-
114
-
115
-
116
-
117
-
118
-
119
-
120
-
121
-
122
-
123
-
124
-
125
-
126
-
127
-
128
-
129
-
130
-
131
-
132
-
133
-
134
-
135
-
136
-
137
-
138
-
139
-
140
-
141
-
142
-
143
-
144
-
145
-
146
-
147
-
148
-
149
-
150
-
151
-
152
-
153
-
154
-
155
-
156
-
157
-
158
-
159
-
160
-
161
-
162
-
163
-
164
-
165
-
166
-
167
-
168
-
169
-
170
-
171
-
172
-
173
-
174
-
175
-
176
-
177
-
178
-
179
-
180
-
181
-
182
-
183
-
184
-
185
-
186
-
187
-
188
-
189
-
190
-
191
-
192
-
193
-
194
-
195
-
196
-
197
-
198
-
199
-
200
-
201
-
202
-
203
-
204
-
205
-
206
-
207
-
208
-
209
-
210
-
211
-
212
-
213
-
214
-
215
-
216
-
217
-
218
-
219
-
220
-
221
-
222
-
223
-
224
-
225
-
226
-
227
-
228
-
229
-
230
-
231
-
232
-
233
-
234
-
235
-
236
-
237
-
238
-
239
-
240
-
241
-
242
-
243
-
244
-
245
-
246
-
247
-
248
-
249
-
250
-
251
-
252
-
253
-
254
-
255
-
256
-
257
-
258
-
259
-
260
-
261
-
262
-
263
-
264
-
265
-
266
-
267
-
268
-
269
-
270
-
271
-
272
-
273
-
274
-
275
-
276
-
277
-
278
-
279
-
280
-
281
-
282
-
283
-
284
-
285
-
286
-
287
-
288
-
289
-
290
-
291
-
292
-
293
-
294
-
295
-
296
-
297
-
298
-
299
-
300
-
301
-
302
-
303
-
304
-
305
-
306
-
307
-
308
-
309
-
310
-
311
-
312
-
313
-
314
-
315
-
316
-
317
-
318
-
319
-
320
-
321
-
322
-
323
-
324
-
325
-
326
-
327
-
328
-
329
-
330
-
331
-
332
-
 333
333 -
 334
334 -
 335
335 -
 336
336 -
 337
337 -
 338
338 -
 339
339 -
 340
340 -
 341
341 -
 342
342 -
 343
343 -
 344
344 -
 345
345 -
 346
346 -
 347
347 -
 348
348 -
 349
349 -
 350
350 -
 351
351 -
 352
352 -
 353
353 -
354
-
355
-
356
-
357
-
358
-
359
-
360
-
361
-
362
-
363
-
364
-
365
-
366
-
367
-
368
-
369
-
370
-
371
-
372
-
373
-
374
-
375
-
376
-
377
-
378
-
379
-
380
-
381
-
382
-
383
-
384
-
385
-
386
-
387
-
388
-
389
-
390
-
391
-
392
-
393
-
394
-
395
-
396
-
397
-
398
-
399
-
400
-
401
-
402
-
403
-
404
-
405
-
406
-
407
-
408
-
409
-
410
-
411
-
412
-
413
-
414
-
415
-
416
-
417
-
418
-
419
-
420
-
421
-
422
-
423
-
424
-
425
-
426
-
427
-
428
-
429
-
430
-
431
-
432
-
433
-
434
-
435
-
436
-
437
-
438
-
439
-
440
 |
 |

341
Overview Operating & Financial Review Corporate Governance Financial Statements Shareholder Information
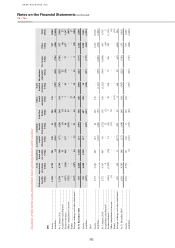
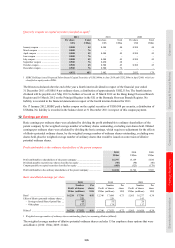
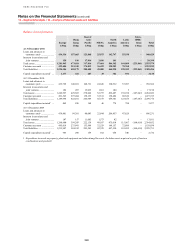
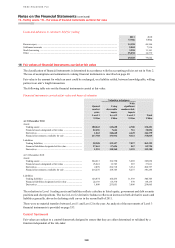
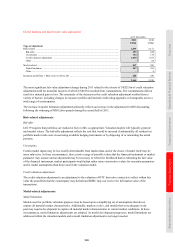
Other financial information
Net operating income by global business
RBWM1 CMB GB&M1 GPB Other2
Intra-
HSBC
items
Total
US$m US$m US$m US$m US$m US$m US$m
2011
Net operating income .................. 24,214 13,873 16,073 3,206 9,145 (6,358) 60,153
External .................................. 22,705 13,624 18,897 2,121 2,806 – 60,153
Internal .................................... 1,509 249 (2,824) 1,085 6,339 (6,358) –
2010
Net operating income .................. 22,352 12,029 17,922 3,105 4,663 (5,863) 54,208
External .................................. 20,797 11,419 20,822 2,194 (1,024) – 54,208
Internal .................................... 1,555 610 (2,900) 911 5,687 (5,863) –
2009
Net operating income .................. 16,395 9,571 17,770 2,984 (2,031) (4,996) 39,693
External .................................. 14,847 9,285 20,340 2,275 (7,054) – 39,693
Internal .................................... 1,548 286 (2,570) 709 5,023 (4,996) –
1 With effect from 1 March 2011, our Global Asset Management business was moved from GB&M to RBWM. This resulted in a
reallocation between the two of US$1,035m and US$882m in net operating income in 2010 and 2009, respectively. The numbers have
been adjusted accordingly.
2 The main items reported in the ‘Other’ category are certain property activities, unallocated investment activities, centrally held
investment companies, movements in fair value of own debt and HSBC’s holding company and financing operations. The ‘Other’
category also includes gains and losses on the disposal of certain significant subsidiaries or business units.
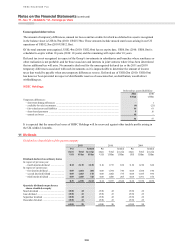
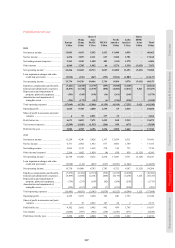
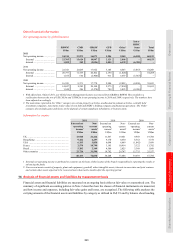
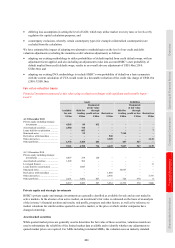
Information by country
2011 2010 2009
External net
operating
income1
Non-
current
assets2
External net
operating
income1
Non-
current
assets2
External net
operating
income1
Non-
current
assets2
US$m US$m US$m US$m US$m US$m
UK ....................................................................... 13,940 21,414 11,467 19,661 9,958 19,704
Hong Kong ......................................................... 9,442 6,257 9,170 4,630 8,352 3,374
USA .................................................................... 6,193 3,830 6,098 6,669 (1,042) 5,499
France ................................................................. 2,570 10,790 3,185 10,914 3,322 11,782
Brazil ................................................................... 5,282 2,149 4,506 2,025 3,368 1,868
Other countries ................................................... 22,726 31,590 19,782 29,747 15,735 25,557
60,153 76,030 54,208 73,646 39,693 67,784
1 External net operating income is attributed to countries on the basis of the location of the branch responsible for reporting the results or
advancing the funds.
2 Non-current assets consist of property, plant and equipment, goodwill, other intangible assets, interests in associates and joint ventures
and certain other assets expected to be recovered more than twelve months after the reporting period.
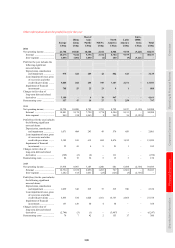
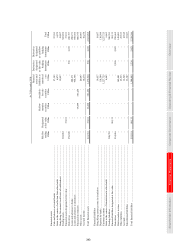
14 Analysis of financial assets and liabilities by measurement basis
Financial assets and financial liabilities are measured on an ongoing basis either at fair value or at amortised cost. The
summary of significant accounting policies in Note 2 describes how the classes of financial instruments are measured,
and how income and expenses, including fair value gains and losses, are recognised. The following table analyses the
carrying amounts of the financial assets and liabilities by category as defined in IAS 39 and by balance sheet heading.