ComEd 2013 Annual Report Download - page 90
Download and view the complete annual report
Please find page 90 of the 2013 ComEd annual report below. You can navigate through the pages in the report by either clicking on the pages listed below, or by using the keyword search tool below to find specific information within the annual report.-
 1
1 -
2
-
3
-
4
-
5
-
6
-
7
-
8
-
9
-
10
-
11
-
12
-
13
-
14
-
15
-
16
-
17
-
18
-
19
-
20
-
21
-
22
-
23
-
24
-
25
-
26
-
27
-
28
-
29
-
30
-
31
-
32
-
33
-
34
-
35
-
36
-
37
-
38
-
39
-
40
-
41
-
42
-
43
-
44
-
45
-
46
-
47
-
48
-
49
-
50
-
51
-
52
-
53
-
54
-
55
-
56
-
57
-
58
-
59
-
60
-
61
-
62
-
63
-
64
-
65
-
66
-
67
-
68
-
69
-
70
-
71
-
72
-
73
-
74
-
75
-
76
-
77
-
78
-
79
-
 80
80 -
 81
81 -
 82
82 -
 83
83 -
 84
84 -
 85
85 -
 86
86 -
 87
87 -
 88
88 -
 89
89 -
 90
90 -
 91
91 -
 92
92 -
 93
93 -
 94
94 -
 95
95 -
 96
96 -
 97
97 -
 98
98 -
 99
99 -
 100
100 -
101
-
102
-
103
-
104
-
105
-
106
-
107
-
108
-
109
-
110
-
111
-
112
-
113
-
114
-
115
-
116
-
117
-
118
-
119
-
120
-
121
-
122
-
123
-
124
-
125
-
126
-
127
-
128
-
129
-
130
-
131
-
132
-
133
-
134
-
135
-
136
-
137
-
138
-
139
-
140
-
141
-
142
-
143
-
144
-
145
-
146
-
147
-
148
-
149
-
150
-
151
-
152
-
153
-
154
-
155
-
156
-
157
-
158
-
159
-
160
-
161
-
162
-
163
-
164
-
165
-
166
-
167
-
168
-
169
-
170
-
171
-
172
-
173
-
174
-
175
-
176
-
177
-
178
-
179
-
180
-
181
-
182
-
183
-
184
-
185
-
186
-
187
-
188
-
189
-
190
-
191
-
192
-
193
-
194
-
195
-
196
-
197
-
198
-
199
-
200
-
201
-
202
-
203
-
204
-
205
-
206
-
207
-
208
-
209
-
210
-
211
-
212
-
213
-
214
-
215
-
216
-
217
-
218
-
219
-
220
-
221
-
222
-
223
-
224
-
225
-
226
-
227
-
228
-
229
-
230
-
231
-
232
-
233
-
234
-
235
-
236
-
237
-
238
-
239
-
240
-
241
-
242
-
243
-
244
-
245
-
246
-
247
-
248
-
249
-
250
-
251
-
252
-
253
-
254
-
255
-
256
-
257
-
258
-
259
-
260
 |
 |

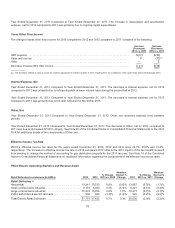
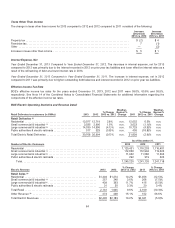
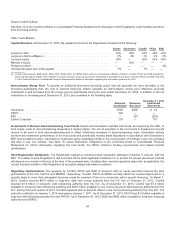
Taxes Other Than Income
Thechangeintaxesother than incomefor 2013 comparedto 2012 and2012 comparedto 2011 consistedofthefollowing:
Increase
(Decrease)
2013 vs. 2012
Increase
(Decrease)
2012 vs. 2011
Propertytax........................................................................... $ (2)$4
Franchisetax.......................................................................... 7 (1)
Other ................................................................................ — (2)
Increaseintaxesother than income....................................................... $ 5 $1
Interest Expense, Net
Year Ended December 31, 2013 Compared to Year Ended December 31, 2012. Thedecreaseininterestexpense,net for 2013
comparedto 2012 wasprimarilydue to theinterestrecordedin 2012 on prior year taxliabilitiesandlower effectiveinterest ratesasa
result oftherefinancingofdebtatalower interest rate in 2013.
Year Ended December 31, 2012 Compared to Year Ended December 31, 2011. Theincreaseininterestexpense,net in 2012
comparedto 2011 wasprimarilydue to higher outstandingdebtbalancesandinterestrecordedin 2012 on prior year taxliabilities.
Effective Income Tax Rate
BGE’s effectiveincometaxratesfor theyearsendedDecember 31,2013,2012 and2011 were 39.0%, 63.6% and35.5%,
respectively. See Note 14oftheCombinedNotesto ConsolidatedFinancial Statementsfor additional information regardingthe
componentsoftheeffectiveincometaxrates.
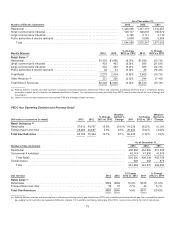
BGE Electric Operating Statistics and Revenue Detail
Retail Deliveries to customers (in GWhs) 2013 2012
% Change
2013 vs. 2012
Weather-
Normal %
Change 2011
% Change
2012 vs. 2011
Weather-
Normal %
Change
Retail Deliveries (a)
Residential ......................................... 13,077 12,7192.8% n.m. 12,6520.5% n.m.
Small commercial &industrial (c) ....................... 3,0352,9901.5% n.m. 3,023 (1.1)% n.m.
Largecommercial &industrial (c) ....................... 14,33914,956 (4.1)% n.m. 15,729 (4.9)% n.m.
Public authorities&electric railroads.................... 317329(3.6)% n.m. 405(18.8)% n.m.
Total Electric RetailDeliveries ......................... 30,768 30,994 (0.7)% n.m. 31,809(2.6)% n.m.
As of December 31,
Number of Electric Customers 2013 2012 2011
Residential .................................................................... 1,120,431 1,116,233 1,116,401
Small commercial &industrial (c) ................................................... 112,850 112,994 113,026
Largecommercial &industrial (c) ................................................... 11,65211,58011,365
Public authorities&electric railroads ............................................... 292319326
Total ...................................................................... 1,245,2251,241,1261,241,118
Electric Revenue 2013 2012
% Change
2013 vs. 2012 2011
% Change
2012 vs. 2011
Retail Sales (a)
Residential .................................................... $1,404$1,274 10.2%$1,456 (12.5)%
Small commercial &industrial (c) .................................. 257 248 3.6% 268 (7.5)%
Largecommercial &industrial (c) ................................... 43939311.7% 416 (5.5)%
Public authorities&electric railroads............................... 31 30 3.3%293.4%
Total Retail.................................................... 2,131 1,945 9.6% 2,169 (10.3)%
Other Revenue (b) .............................................. 274 23815.1%15256.6%
Total Electric Revenues ......................................... $2,405$2,18310.2%$2,321 (5.9)%
84