ComEd 2013 Annual Report Download - page 81
Download and view the complete annual report
Please find page 81 of the 2013 ComEd annual report below. You can navigate through the pages in the report by either clicking on the pages listed below, or by using the keyword search tool below to find specific information within the annual report.-
 1
1 -
2
-
3
-
4
-
5
-
6
-
7
-
8
-
9
-
10
-
11
-
12
-
13
-
14
-
15
-
16
-
17
-
18
-
19
-
20
-
21
-
22
-
23
-
24
-
25
-
26
-
27
-
28
-
29
-
30
-
31
-
32
-
33
-
34
-
35
-
36
-
37
-
38
-
39
-
40
-
41
-
42
-
43
-
44
-
45
-
46
-
47
-
48
-
49
-
50
-
51
-
52
-
53
-
54
-
55
-
56
-
57
-
58
-
59
-
60
-
61
-
62
-
63
-
64
-
65
-
66
-
67
-
68
-
69
-
70
-
 71
71 -
 72
72 -
 73
73 -
 74
74 -
 75
75 -
 76
76 -
 77
77 -
 78
78 -
 79
79 -
 80
80 -
 81
81 -
 82
82 -
 83
83 -
 84
84 -
 85
85 -
 86
86 -
 87
87 -
 88
88 -
 89
89 -
 90
90 -
 91
91 -
92
-
93
-
94
-
95
-
96
-
97
-
98
-
99
-
100
-
101
-
102
-
103
-
104
-
105
-
106
-
107
-
108
-
109
-
110
-
111
-
112
-
113
-
114
-
115
-
116
-
117
-
118
-
119
-
120
-
121
-
122
-
123
-
124
-
125
-
126
-
127
-
128
-
129
-
130
-
131
-
132
-
133
-
134
-
135
-
136
-
137
-
138
-
139
-
140
-
141
-
142
-
143
-
144
-
145
-
146
-
147
-
148
-
149
-
150
-
151
-
152
-
153
-
154
-
155
-
156
-
157
-
158
-
159
-
160
-
161
-
162
-
163
-
164
-
165
-
166
-
167
-
168
-
169
-
170
-
171
-
172
-
173
-
174
-
175
-
176
-
177
-
178
-
179
-
180
-
181
-
182
-
183
-
184
-
185
-
186
-
187
-
188
-
189
-
190
-
191
-
192
-
193
-
194
-
195
-
196
-
197
-
198
-
199
-
200
-
201
-
202
-
203
-
204
-
205
-
206
-
207
-
208
-
209
-
210
-
211
-
212
-
213
-
214
-
215
-
216
-
217
-
218
-
219
-
220
-
221
-
222
-
223
-
224
-
225
-
226
-
227
-
228
-
229
-
230
-
231
-
232
-
233
-
234
-
235
-
236
-
237
-
238
-
239
-
240
-
241
-
242
-
243
-
244
-
245
-
246
-
247
-
248
-
249
-
250
-
251
-
252
-
253
-
254
-
255
-
256
-
257
-
258
-
259
-
260
 |
 |

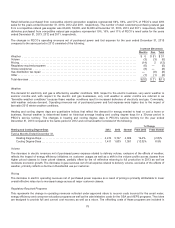
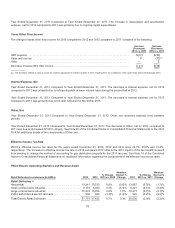
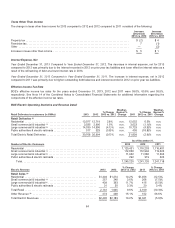
Retaildeliveriespurchasedfromcompetitive electric generation suppliersrepresented 68%, 66%, and 57% of PECO’s retailkWh
salesfor theyearsendedDecember 31,2013,2012 and2011,respectively. Thenumber ofretailcustomerspurchasingnatural gas
fromacompetitive natural gassupplier was 66,400,53,600,and24,800 at December 31,2013,2012 and2011,respectively. Retail
deliveriespurchasedfromcompetitive natural gassuppliersrepresented19%, 16%, and11%of PECO’s mmcf salesfor theyears
endedDecember 31,2013,2012 and2011,respectively.
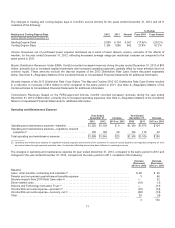
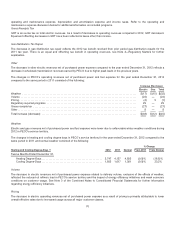
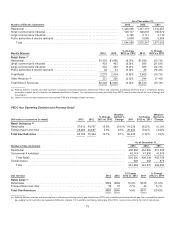
ThechangesinPECO’s operatingrevenuesnet ofpurchasedpower andfuel expensefor theyear endedDecember 31,2013
comparedto thesame periodin 2012 consistedofthefollowing:
Increase (Decrease)
Electric Gas Total
Weather ................................................................................... $ 6 $ 31 $37
Volume.................................................................................... (3)(3) (6)
Pricing..................................................................................... (14) 2(12)
Regulatoryrequiredprograms ................................................................. (6) — (6)
Gross receiptstax ........................................................................... (8) — (8)
Gas distribution taxrepair..................................................................... — (8) (8)
Other ...................................................................................... (7) (1) (8)
Total decrease.............................................................................. $(32)$21 $(11)
Weather
Thedemandfor electricityandgasisaffectedbyweather conditions. Withrespecttothe electric business, verywarmweather in
summer months and, withrespecttothe electric andgasbusinesses, verycoldweather inwinter months are referredto as
“favorable weather conditions” becausetheseweather conditionsresult inincreaseddeliveriesofelectricityandgas. Conversely,
mildweather reducesdemand. Operatingrevenuesnet ofpurchasedpower andfuel expensewere higher due to theimpactof
favorable 2013 winter weather conditions.
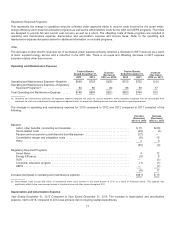
Heatingandcoolingdegree days are quantitativeindicesthat reflectthedemandfor energy neededto heat or cool a homeor
business. Normal weather is determinedbasedon historical averageheatingandcoolingdegree days for a 30-year periodin
PECO’s service territory. Thechangesinheatingandcoolingdegree days inPECO’s service territoryfor theyear ended
December 31,2013 comparedto thesame periodin 2012 andnormal weather consistedofthefollowing:
% Change
Heating and Cooling Degree-Days 2013 2012 Normal From 2012 From Normal
TwelveMonths EndedDecember 31,
HeatingDegree-Days............................................ 4,474 3,747 4,603 19.4% (2.8)%
CoolingDegree-Days............................................ 1,411 1,603 1,301 (12.0)% 8.5%
Volume
Thedecreasein electric revenuesnet ofpurchasedpower expense relatedto deliveryvolume,exclusiveoftheeffectsofweather,
reflectstheimpactofenergy efficiency initiativeson customer usagesaswell asashiftinthevolume profile across classesfrom
higher pricedclassesto lower pricedclasses, partiallyoffset by theoilrefineriesreturningto full production in 2013 aswell as
moderate economic growth. Thedecreaseingasrevenuesnet offuel expense relatedto deliveryvolume,exclusiveoftheeffectsof
weather,primarilyreflectsadecline inResidential use per customer.
Pricing
Thedecreasein electric operatingrevenuesnet ofpurchasedpower expenseasaresult ofpricingisprimarilyattributable to lower
overall effective ratesdue to increasedusageacross all major customer classes.
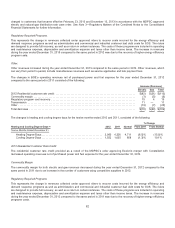
Regulatory Required Programs
This representsthechangein operatingrevenuescollectedunder approvedridersto recover costsincurredfor thesmart meter,
energy efficiency andconsumer education programs aswell astheadministrativecostsfor theGSAandAEPS programs. Theriders
are designedto providefull andcurrent costrecoveryaswell asa return.Theoffsettingcostsofthese programs are includedin
75