ComEd 2013 Annual Report Download - page 77
Download and view the complete annual report
Please find page 77 of the 2013 ComEd annual report below. You can navigate through the pages in the report by either clicking on the pages listed below, or by using the keyword search tool below to find specific information within the annual report.-
 1
1 -
2
-
3
-
4
-
5
-
6
-
7
-
8
-
9
-
10
-
11
-
12
-
13
-
14
-
15
-
16
-
17
-
18
-
19
-
20
-
21
-
22
-
23
-
24
-
25
-
26
-
27
-
28
-
29
-
30
-
31
-
32
-
33
-
34
-
35
-
36
-
37
-
38
-
39
-
40
-
41
-
42
-
43
-
44
-
45
-
46
-
47
-
48
-
49
-
50
-
51
-
52
-
53
-
54
-
55
-
56
-
57
-
58
-
59
-
60
-
61
-
62
-
63
-
64
-
65
-
66
-
 67
67 -
 68
68 -
 69
69 -
 70
70 -
 71
71 -
 72
72 -
 73
73 -
 74
74 -
 75
75 -
 76
76 -
 77
77 -
 78
78 -
 79
79 -
 80
80 -
 81
81 -
 82
82 -
 83
83 -
 84
84 -
 85
85 -
 86
86 -
 87
87 -
88
-
89
-
90
-
91
-
92
-
93
-
94
-
95
-
96
-
97
-
98
-
99
-
100
-
101
-
102
-
103
-
104
-
105
-
106
-
107
-
108
-
109
-
110
-
111
-
112
-
113
-
114
-
115
-
116
-
117
-
118
-
119
-
120
-
121
-
122
-
123
-
124
-
125
-
126
-
127
-
128
-
129
-
130
-
131
-
132
-
133
-
134
-
135
-
136
-
137
-
138
-
139
-
140
-
141
-
142
-
143
-
144
-
145
-
146
-
147
-
148
-
149
-
150
-
151
-
152
-
153
-
154
-
155
-
156
-
157
-
158
-
159
-
160
-
161
-
162
-
163
-
164
-
165
-
166
-
167
-
168
-
169
-
170
-
171
-
172
-
173
-
174
-
175
-
176
-
177
-
178
-
179
-
180
-
181
-
182
-
183
-
184
-
185
-
186
-
187
-
188
-
189
-
190
-
191
-
192
-
193
-
194
-
195
-
196
-
197
-
198
-
199
-
200
-
201
-
202
-
203
-
204
-
205
-
206
-
207
-
208
-
209
-
210
-
211
-
212
-
213
-
214
-
215
-
216
-
217
-
218
-
219
-
220
-
221
-
222
-
223
-
224
-
225
-
226
-
227
-
228
-
229
-
230
-
231
-
232
-
233
-
234
-
235
-
236
-
237
-
238
-
239
-
240
-
241
-
242
-
243
-
244
-
245
-
246
-
247
-
248
-
249
-
250
-
251
-
252
-
253
-
254
-
255
-
256
-
257
-
258
-
259
-
260
 |
 |

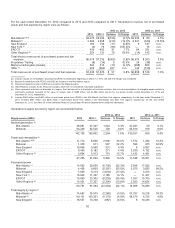
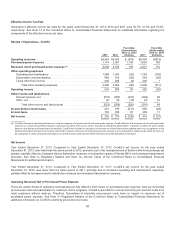
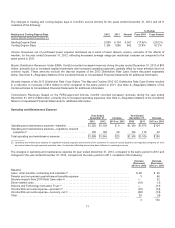
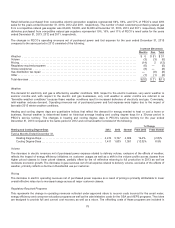
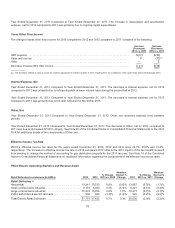
Thechangesinheatingandcoolingdegree days inComEd’s service territoryfor theyearsendedDecember 31,2012 and2011
consistedofthefollowing:
% Change
Heating and Cooling Degree-Days 2012 2011 Normal From 2011 From Normal
TwelveMonths EndedDecember 31,
HeatingDegree-Days .............................................. 5,065 6,1346,341(17.4)% (20.1)%
CoolingDegree-Days .............................................. 1,3241,03684227.8% 57.2%
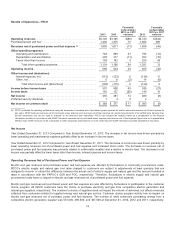
Volume. Revenuesnet ofpurchasedpower expensedecreasedasaresult oflower deliveryvolume,exclusiveoftheeffectsof
weather,for theyear endedDecember 31,2012,reflectingdecreasedaverageusage per residential customer ascomparedto the
same periodin 2011.
Electric Distribution Revenues. Under EIMA,ComEd recordedincreasedrevenuesduringtheyear endedDecember 31,2012 of$53
million,primarilydue to increasedcapital investmentsandincreasedoperatingexpenses, partiallyoffset by lower allowedreturn on
common equity. Theseamountsexcludethediscrete impactsofthe 2012 Distribution Rate CaseOrders discussedseparately
below. See Note 3—RegulatoryMattersoftheCombinedNotesto ConsolidatedFinancial Statementsfor additional information.
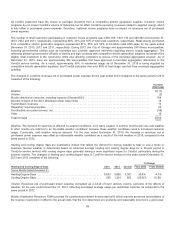
Discrete Impacts of the 2012 Distribution Rate Case Orders. TheMayandOctober 2012 ICC Distribution Rate CaseOrdersresulted
inareduction to revenuesof$13 million in 2012 comparedto thesame periodin 2011.See Note 3—RegulatoryMattersofthe
CombinedNotesto ConsolidatedFinancial Statementsfor additional information.
Transmission Revenues. Basedon theFERC-approvedformula,ComEd recordedincreasedrevenuesduringtheyear ended
December 31,2012 of$40million,primarilydue to increasedoperatingexpenses. See Note 3—RegulatoryMattersoftheCombined
Notesto ConsolidatedFinancial Statementsfor additional information.
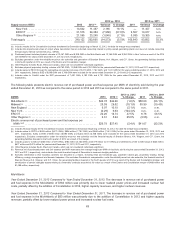
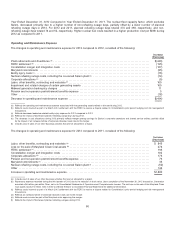
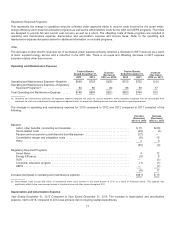
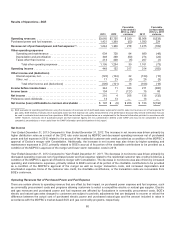
Operating and Maintenance Expense
Year Ended
December 31, Increase
Year Ended
December 31, Increase
2013 2012 2013 vs. 2012 2012 2011 2012 vs. 2011
Operatingandmaintenanceexpense—baseline ............. $1,202 $1,199 $ 3$1,199 $1,075 $124
Operatingandmaintenanceexpense—regulatoryrequired
programs (a).......................................... 166 146 20 146 11432
Total operatingandmaintenanceexpense.................. $1,368 $1,345 $23 $1,345 $1,189 $156
(a)Operatingandmaintenanceexpensefor regulatoryrequiredprograms are recoveriesfromcustomersfor costsofvariouslegislativeandregulatoryprograms on a full
andcurrent basis through approvedregulatedrates. An equal andoffsettingamount hasbeen reflectedin operatingrevenues.
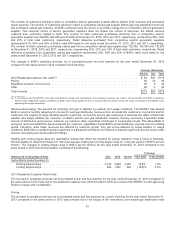
Thechangesin operatingandmaintenanceexpensefor year endedDecember 31,2013,comparedto thesame periodin 2012 and
changesfor theyear endedDecember 31,2012,comparedto thesame periodin 2011,consistedofthefollowing:
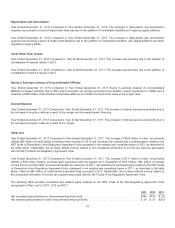
Increase
(Decrease)
2013 vs. 2012
Increase
(Decrease)
2012 vs. 2011
Baseline
Labor,other benefits, contractingandmaterials(a)............................................ $ 48 $ 95
Pension andnon-pension postretirement benefitsexpense.................................... 346
Discrete impactsfrom2010 Rate Caseorder (b) .............................................. — 32
Storm-relatedcosts..................................................................... (10)(1)
ScienceandTechnology Innovation Trust(c) ................................................ — (11)
Uncollectible accountsexpense—provision (d) ............................................... (10)(14)
Uncollectible accountsexpense—recovery, net (d) ............................................ (48) (14)
Other ................................................................................ 20 (9)
3124
71