ComEd 2013 Annual Report Download - page 41
Download and view the complete annual report
Please find page 41 of the 2013 ComEd annual report below. You can navigate through the pages in the report by either clicking on the pages listed below, or by using the keyword search tool below to find specific information within the annual report.-
 1
1 -
2
-
3
-
4
-
5
-
6
-
7
-
8
-
9
-
10
-
11
-
12
-
13
-
14
-
15
-
16
-
17
-
18
-
19
-
20
-
21
-
22
-
23
-
24
-
25
-
26
-
27
-
28
-
29
-
30
-
 31
31 -
 32
32 -
 33
33 -
 34
34 -
 35
35 -
 36
36 -
 37
37 -
 38
38 -
 39
39 -
 40
40 -
 41
41 -
 42
42 -
 43
43 -
 44
44 -
 45
45 -
 46
46 -
 47
47 -
 48
48 -
 49
49 -
 50
50 -
 51
51 -
52
-
53
-
54
-
55
-
56
-
57
-
58
-
59
-
60
-
61
-
62
-
63
-
64
-
65
-
66
-
67
-
68
-
69
-
70
-
71
-
72
-
73
-
74
-
75
-
76
-
77
-
78
-
79
-
80
-
81
-
82
-
83
-
84
-
85
-
86
-
87
-
88
-
89
-
90
-
91
-
92
-
93
-
94
-
95
-
96
-
97
-
98
-
99
-
100
-
101
-
102
-
103
-
104
-
105
-
106
-
107
-
108
-
109
-
110
-
111
-
112
-
113
-
114
-
115
-
116
-
117
-
118
-
119
-
120
-
121
-
122
-
123
-
124
-
125
-
126
-
127
-
128
-
129
-
130
-
131
-
132
-
133
-
134
-
135
-
136
-
137
-
138
-
139
-
140
-
141
-
142
-
143
-
144
-
145
-
146
-
147
-
148
-
149
-
150
-
151
-
152
-
153
-
154
-
155
-
156
-
157
-
158
-
159
-
160
-
161
-
162
-
163
-
164
-
165
-
166
-
167
-
168
-
169
-
170
-
171
-
172
-
173
-
174
-
175
-
176
-
177
-
178
-
179
-
180
-
181
-
182
-
183
-
184
-
185
-
186
-
187
-
188
-
189
-
190
-
191
-
192
-
193
-
194
-
195
-
196
-
197
-
198
-
199
-
200
-
201
-
202
-
203
-
204
-
205
-
206
-
207
-
208
-
209
-
210
-
211
-
212
-
213
-
214
-
215
-
216
-
217
-
218
-
219
-
220
-
221
-
222
-
223
-
224
-
225
-
226
-
227
-
228
-
229
-
230
-
231
-
232
-
233
-
234
-
235
-
236
-
237
-
238
-
239
-
240
-
241
-
242
-
243
-
244
-
245
-
246
-
247
-
248
-
249
-
250
-
251
-
252
-
253
-
254
-
255
-
256
-
257
-
258
-
259
-
260
 |
 |
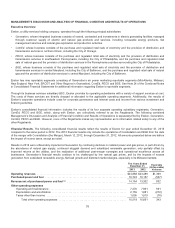
demandresponse programs, decreasedgross receiptstaxrevenue,andthecustomer refundin 2013 ofthetaxcash benefit
relatedto gasproperty distribution repairs.
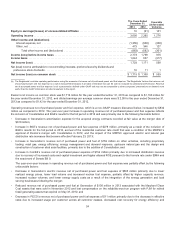
Operatingandmaintenanceexpensedecreased by $691million ascomparedto 2012 primarilydue to thefollowingfavorable
factors:
•Decreasein operatingandmaintenanceexpenseassociatedwiththegeneratingassetsretiredor divestedduring2012 of $442
million;
•CostsincurredinMarch 2012 of$216million and$195 million aspart oftheMarylandorder approvingthemerger anda
settlement withtheFERC, respectively;
•DecreaseinConstellation merger andintegration costsof$201 million in 2013;and
•Decreaseinuncollectible accountsexpenseof $58 million at ComEd resultingfromthetimingofregulatorycostrecoveryand
customerspurchasingelectricityfromcompetitive electric generation suppliers.
Theyear-over-year decreasein operatingandmaintenanceexpensewaspartiallyoffset by thefollowingunfavorable factors:
•Increaseinlabor,other benefits, contractingandmaterialscostsof$298 million,primarilydue to theaddition of BGE and
Constellation for thefull periodin 2013;and
•Long-livedasset impairmentsandrelatedchargesof$174 million in 2013,primarilyrelatedto Generation’s cancellation of
nuclear uprate projectsandtheimpairment ofcertainwindgeneratingassets.
Depreciation andamortization expenseincreasedby$272million primarilydue to theaddition of BGE andConstellation for thefull
periodin 2013,ongoingcapital expendituresacross the operatingcompanies, thecompletion ofwindandsolar facilitiesplacedinto
serviceinthesecondhalfof2012 andin 2013 at Generation,andincreasedregulatoryasset amortization relatedto higher MGP
remediation expendituresand higher costsfor energy efficiency anddemandresponse programs at ComEd and BGE, respectively.
Thefavorable increaseinEquityin earnings/loss ofunconsolidatedaffiliatesof$101 million wasprimarilydue to higher net income
fromGeneration’s equityinvestment inCENG in 2013 comparedto thesame periodin 2012 andlower amortization ofthebasis
differenceofGeneration’s ownershipinterestinCENG recordedat fairvalue inconnection withthemerger.
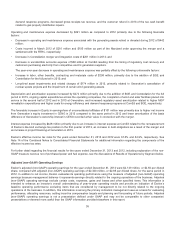
Interestexpenseincreasedby$428million primarilydue to an increaseininterestexpenseatComEd relatedto theremeasurement
ofExelon’s like-kindexchangetaxposition inthefirstquarter of2013,an increaseindebtobligationsasaresult ofthemerger and
an increasein projectfinancingat Generation in 2013.
Exelon’s effectiveincometaxratesfor theyearsendedDecember 31,2013 and2012 were 37.6% and34.9%, respectively. See
Note 14oftheCombinedNotesto ConsolidatedFinancial Statementsfor additional information regardingthecomponentsofthe
effectiveincometaxrates.
For further detailregardingthefinancial resultsfor theyearsendedDecember 31,2013 and2012,includingexplanation ofthe non-
GAAPmeasure revenue net ofpurchasedpower andfuel expense,see thediscussionsofResultsofOperationsbySegment below.
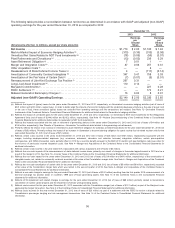
Adjusted (non-GAAP) Operating Earnings
Exelon’s adjusted(non-GAAP) operatingearnings for theyear endedDecember 31,2013 were $2,149 million,or $2.50 per diluted
share,comparedwithadjusted(non-GAAP) operatingearnings of$2,330 million,or $2.85 per dilutedshare,for thesame periodin
2012.Inaddition to net income,Exelon evaluatesitsoperatingperformanceusingthemeasure ofadjusted(non-GAAP) operating
earnings becausemanagement believesit representsearnings directlyrelatedto theongoingoperationsofthebusiness. Adjusted
(non-GAAP) operatingearnings excludecertaincosts, expenses, gainsandlossesandother specifieditems. This information is
intendedto enhanceaninvestor’s overall understandingofyear-to-year operatingresultsandprovideanindication ofExelon’s
baseline operatingperformanceexcludingitems that are consideredbymanagement to be not directlyrelatedto theongoing
operationsofthebusiness. Inaddition,this information is amongtheprimaryindicatorsmanagement usesasabasis for evaluating
performance,allocatingresources, settingincentivecompensation targetsandplanningandforecastingoffuture periods. Adjusted
(non-GAAP) operatingearnings is not a presentation definedunder GAAPandmaynot becomparable to other companies’
presentationsor deemedmore useful than theGAAPinformation providedelsewhere inthis report.
35