ComEd 2013 Annual Report Download - page 252
Download and view the complete annual report
Please find page 252 of the 2013 ComEd annual report below. You can navigate through the pages in the report by either clicking on the pages listed below, or by using the keyword search tool below to find specific information within the annual report.-
 1
1 -
2
-
3
-
4
-
5
-
6
-
7
-
8
-
9
-
10
-
11
-
12
-
13
-
14
-
15
-
16
-
17
-
18
-
19
-
20
-
21
-
22
-
23
-
24
-
25
-
26
-
27
-
28
-
29
-
30
-
31
-
32
-
33
-
34
-
35
-
36
-
37
-
38
-
39
-
40
-
41
-
42
-
43
-
44
-
45
-
46
-
47
-
48
-
49
-
50
-
51
-
52
-
53
-
54
-
55
-
56
-
57
-
58
-
59
-
60
-
61
-
62
-
63
-
64
-
65
-
66
-
67
-
68
-
69
-
70
-
71
-
72
-
73
-
74
-
75
-
76
-
77
-
78
-
79
-
80
-
81
-
82
-
83
-
84
-
85
-
86
-
87
-
88
-
89
-
90
-
91
-
92
-
93
-
94
-
95
-
96
-
97
-
98
-
99
-
100
-
101
-
102
-
103
-
104
-
105
-
106
-
107
-
108
-
109
-
110
-
111
-
112
-
113
-
114
-
115
-
116
-
117
-
118
-
119
-
120
-
121
-
122
-
123
-
124
-
125
-
126
-
127
-
128
-
129
-
130
-
131
-
132
-
133
-
134
-
135
-
136
-
137
-
138
-
139
-
140
-
141
-
142
-
143
-
144
-
145
-
146
-
147
-
148
-
149
-
150
-
151
-
152
-
153
-
154
-
155
-
156
-
157
-
158
-
159
-
160
-
161
-
162
-
163
-
164
-
165
-
166
-
167
-
168
-
169
-
170
-
171
-
172
-
173
-
174
-
175
-
176
-
177
-
178
-
179
-
180
-
181
-
182
-
183
-
184
-
185
-
186
-
187
-
188
-
189
-
190
-
191
-
192
-
193
-
194
-
195
-
196
-
197
-
198
-
199
-
200
-
201
-
202
-
203
-
204
-
205
-
206
-
207
-
208
-
209
-
210
-
211
-
212
-
213
-
214
-
215
-
216
-
217
-
218
-
219
-
220
-
221
-
222
-
223
-
224
-
225
-
226
-
227
-
228
-
229
-
230
-
231
-
232
-
233
-
234
-
235
-
236
-
237
-
238
-
239
-
240
-
241
-
 242
242 -
 243
243 -
 244
244 -
 245
245 -
 246
246 -
 247
247 -
 248
248 -
 249
249 -
 250
250 -
 251
251 -
 252
252 -
 253
253 -
 254
254 -
 255
255 -
 256
256 -
 257
257 -
 258
258 -
 259
259 -
 260
260
 |
 |

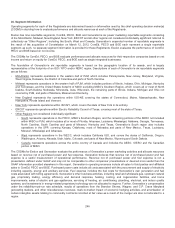
24. Segment Information
Operatingsegmentsfor each oftheRegistrantsare determinedbasedon information usedbythechiefoperatingdecision maker(s)
(CODM) indecidinghowto evaluate performanceandallocate resourcesat each oftheRegistrants.
Exelon hasnine reportable segments, ComEd, PECO, BGE andGeneration’s six power marketingreportable segmentsconsisting
oftheMid-Atlantic, Midwest,NewEngland, NewYork, ERCOT andall other regionsnot consideredindividually significant referredto
collectivelyas“Other Regions”; includingtheSouth, WestandCanada.Generation’s expandednumber ofreportable segmentsis
theresult oftheacquisition ofConstellation on March 12,2012.ComEd, PECO and BGE each represent a single reportable
segment;assuch, no separate segment information is providedfor theseRegistrants. Exelon evaluatesthe performanceofComEd,
PECO and BGE basedon net income.
TheCODMs for ComEd, PECO, and BGE evaluate performanceandallocate resourcesfor theirrespectivecompaniesbasedon net
incomeandreturn on equityfor ComEd, PECO, and BGE each assingle integratedbusinesses.
Thefoundation ofGeneration’s six reportable segmentsisbasedon thegeographic location ofitsassets, andislargely
representativeofthefootprintsofan ISO / RTO and/or NERCregion.Descriptionsofeach ofGeneration’s six reportable segments
are asfollows:
•Mid-Atlantic representsoperationsintheeastern halfof PJM, which includesPennsylvania,NewJersey, Maryland, Virginia,
WestVirginia,Delaware,theDistrictofColumbiaandpartsofNorthCarolina.
• Midwest representsoperationsinthewestern halfof PJM, which includesportionsofIllinois, Indiana, Ohio, Michigan,Kentucky
andTennessee,andtheUnitedStatesfootprint of MISO excluding MISO’s Southern Region, which coversall or mostofNorth
Dakota,SouthDakota,Nebraska,Minnesota,Iowa, Wisconsin,theremainingpartsofIllinois, Indiana, Michigan and Ohio not
covered by PJM, andpartsofMontana, MissouriandKentucky.
• NewEnglandrepresentsthe operationswithinISO-NE coveringthestatesofConnecticut,Maine,Massachusetts, New
Hampshire,RhodeIslandandVermont.
• NewYorkrepresentsoperationswithinISO-NY, which coversthestate ofNewYorkinitsentirety.
•ERCOT representsoperationswithinElectric ReliabilityCouncilofTexas, coveringmostofthestate ofTexas.
•Other Regionsnot consideredindividually significant:
•SouthrepresentsoperationsintheFRCC, MISO’s Southern Region,andtheremainingportionsoftheSERCnot included
withinMISO or PJM, which includesall or mostofFlorida,Arkansas, Louisiana, Mississippi, Alabama,Georgia,Tennessee,
NorthCarolina,SouthCarolina andpartsof Missouri, Kentucky andTexas. Generation’s Southregion alsoincludes
operationsintheSPP, coveringKansas, Oklahoma,mostofNebraskaandpartsofNewMexico,Texas, Louisiana,
Missouri, MississippiandArkansas.
•West representsoperationsintheWECC, which includesCaliforniaISO, andcoversthestatesofCalifornia,Oregon,
Washington,Arizona,Nevada,Utah, Idaho,Colorado,andpartsofNewMexico,WyomingandSouthDakota.
•Canada representsoperationsacross the entire countryofCanadaandincludestheAESO, OIESO andtheCanadian
portion of MISO.
TheCODMs for Exelon andGeneration evaluate the performanceofGeneration’s power marketingactivitiesandallocate resources
basedon revenue net ofpurchasedpower andfuel expense.Generation believesthat revenue net ofpurchasedpower andfuel
expenseis auseful measurement ofoperational performance.Revenue net ofpurchasedpower andfuel expenseis not a
presentation definedunder GAAPandmaynot becomparable to other companies’ presentationsor deemedmore useful than the
GAAPinformation providedelsewhere inthis report.Generation’s operatingrevenuesinclude all salesto thirdpartiesandaffiliated
salesto ComEd, PECO and BGE. Purchasedpower costsinclude all costsassociatedwiththe procurement andsupplyofelectricity
includingcapacity, energy andancillaryservices. Fuel expenseincludesthefuel costsfor Generation’s owngeneration andfuel
costsassociatedwithtollingagreements. Generation’s other business activities, includingretailandwholesale gas, upstreamnatural
gas, proprietarytrading, energy efficiency anddemandresponse,heating, cooling, andcogeneration facilities, andhome
improvements, salesofelectric andgasappliances, servicingofheating, airconditioning, plumbing, electrical,andindoor quality
systems, andinvestmentsin energy-relatedproprietarytechnology are not allocatedto regions. Further,Generation’s compensation
under the reliability-must-run rate schedule,resultsofoperationsfromtheBrandon Shores, Wagner,and C.P. Crane Maryland
generatingstations, andother miscellaneousrevenues, mark-to-market impactofeconomic hedgingactivities, andamortization of
certainintangible assetsrelatingto commoditycontractsrecordedat fairvalue asaresult ofthemerger are also not allocatedto a
region.
246