ComEd 2013 Annual Report Download - page 39
Download and view the complete annual report
Please find page 39 of the 2013 ComEd annual report below. You can navigate through the pages in the report by either clicking on the pages listed below, or by using the keyword search tool below to find specific information within the annual report.-
 1
1 -
2
-
3
-
4
-
5
-
6
-
7
-
8
-
9
-
10
-
11
-
12
-
13
-
14
-
15
-
16
-
17
-
18
-
19
-
20
-
21
-
22
-
23
-
24
-
25
-
26
-
27
-
28
-
 29
29 -
 30
30 -
 31
31 -
 32
32 -
 33
33 -
 34
34 -
 35
35 -
 36
36 -
 37
37 -
 38
38 -
 39
39 -
 40
40 -
 41
41 -
 42
42 -
 43
43 -
 44
44 -
 45
45 -
 46
46 -
 47
47 -
 48
48 -
 49
49 -
50
-
51
-
52
-
53
-
54
-
55
-
56
-
57
-
58
-
59
-
60
-
61
-
62
-
63
-
64
-
65
-
66
-
67
-
68
-
69
-
70
-
71
-
72
-
73
-
74
-
75
-
76
-
77
-
78
-
79
-
80
-
81
-
82
-
83
-
84
-
85
-
86
-
87
-
88
-
89
-
90
-
91
-
92
-
93
-
94
-
95
-
96
-
97
-
98
-
99
-
100
-
101
-
102
-
103
-
104
-
105
-
106
-
107
-
108
-
109
-
110
-
111
-
112
-
113
-
114
-
115
-
116
-
117
-
118
-
119
-
120
-
121
-
122
-
123
-
124
-
125
-
126
-
127
-
128
-
129
-
130
-
131
-
132
-
133
-
134
-
135
-
136
-
137
-
138
-
139
-
140
-
141
-
142
-
143
-
144
-
145
-
146
-
147
-
148
-
149
-
150
-
151
-
152
-
153
-
154
-
155
-
156
-
157
-
158
-
159
-
160
-
161
-
162
-
163
-
164
-
165
-
166
-
167
-
168
-
169
-
170
-
171
-
172
-
173
-
174
-
175
-
176
-
177
-
178
-
179
-
180
-
181
-
182
-
183
-
184
-
185
-
186
-
187
-
188
-
189
-
190
-
191
-
192
-
193
-
194
-
195
-
196
-
197
-
198
-
199
-
200
-
201
-
202
-
203
-
204
-
205
-
206
-
207
-
208
-
209
-
210
-
211
-
212
-
213
-
214
-
215
-
216
-
217
-
218
-
219
-
220
-
221
-
222
-
223
-
224
-
225
-
226
-
227
-
228
-
229
-
230
-
231
-
232
-
233
-
234
-
235
-
236
-
237
-
238
-
239
-
240
-
241
-
242
-
243
-
244
-
245
-
246
-
247
-
248
-
249
-
250
-
251
-
252
-
253
-
254
-
255
-
256
-
257
-
258
-
259
-
260
 |
 |

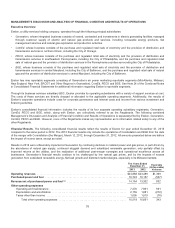
MANAGEMENT’S DISCUSSION AND ANALYSIS OF FINANCIAL CONDITION AND RESULTS OF OPERATIONS
Executive Overview
Exelon,autilityservicesholdingcompany, operatesthrough thefollowingprincipal subsidiaries:
•Generation, whoseintegratedbusiness consistsofowned, contractedandinvestmentsin electric generatingfacilitiesmanaged
through customer supplyofelectric andnatural gasproductsandservices, includingrenewable energy products, risk
management servicesandnatural gasexploration andproduction activities.
•ComEd, whosebusiness consistsofthe purchaseandregulatedretailsale ofelectricityandthe provision of distribution and
transmission servicesin northern Illinois, includingtheCityof Chicago.
•PECO, whosebusiness consistsofthe purchaseandregulatedretailsale ofelectricityandthe provision of distribution and
transmission servicesinsoutheastern Pennsylvania,includingtheCityof Philadelphia,andthe purchaseandregulatedretail
sale ofnatural gasandthe provision of distribution servicesinthePennsylvaniacountiessurroundingtheCityof Philadelphia.
•BGE, whosebusiness consistsofthe purchaseandregulatedretailsale ofelectricityandthe provision of distribution and
transmission servicesincentral Maryland, includingtheCityofBaltimore,andthe purchaseandregulatedretailsale ofnatural
gasandthe provision of distribution servicesincentral Maryland, includingtheCityofBaltimore.
Exelon hasnine reportable segmentsconsistingofGeneration’s six power marketingreportable segments (Mid-Atlantic, Midwest,
NewEngland, NewYork, ERCOT andOther RegionsinGeneration), ComEd, PECO and BGE. See Note 24oftheCombinedNotes
to ConsolidatedFinancial Statementsfor additional information regardingExelon’s reportable segments.
Through itsbusiness servicessubsidiary BSC, Exelon providesitsoperatingsubsidiarieswithavarietyofsupport servicesat cost.
Thecostsoftheseservicesare directlychargedor allocatedto the applicable operatingsegments. Additionally, theresultsof
Exelon’s corporate operationsincludecostsfor corporate governanceandinterestcostsandincomefromvariousinvestment and
financingactivities.
Exelon’s consolidatedfinancial information includestheresultsofitsfour separate operatingsubsidiaryregistrants, Generation,
ComEd, PECO and BGE, which, alongwithExelon,are collectivelyreferredto astheRegistrants. Thefollowingcombined
Management’s Discussion andAnalysis ofFinancial Condition andResultsofOperationsisseparatelyfiledbyExelon,Generation,
ComEd, PECO and BGE. However,none oftheRegistrantsmakesanyrepresentation asto information relatedsolelyto anyofthe
other Registrants.
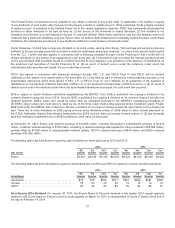
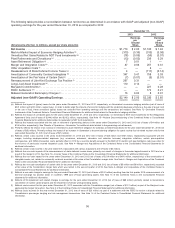
Financial Results. Thefollowingconsolidatedfinancial resultsreflecttheresultsofExelon for year endedDecember 31,2013
comparedto thesame periodin 2012.The 2012 financial resultsonlyincludethe operationsofConstellation and BGE fromthedate
ofthemerger withConstellation (theMerger), March 12,2012,through December 31,2012.All amountspresentedbeloware before
theimpactofincometaxes, except asnoted.
Resultsin 2013 were unfavorablyimpactedat Generation by continuingdeclinesin realizedpower andgasprices, in part driven by
theabundanceofnatural gassupply, continuedsluggish demandandsubsidizedrenewable generation;onlypartiallyoffset by
improvedreturnsat theutilities, andthe realization ofadditional post-merger synergiesandoperational excellenceacross all
businesses. Generation’s financial resultscontinue to bechallengedbylownatural gasprices, andbytheimpactsofexcess
generation fromsubsidizedrenewable energy, flat loadgrowthand distortedmarket designs, especiallyinits Midwestmarkets.
The Years Ended
December 31, Favorable
(Unfavorable)
Variance2013 2012
Operating revenues ................................................................. $24,888 $23,489 $1,399
Purchased power and fuel ........................................................... 10,72410,157 (567)
Revenue net of purchased power and fuel (a) ........................................... 14,164 13,332 832
Other operating expenses
Operatingandmaintenance........................................................ 7,2707,961691
Depreciation andamortization ...................................................... 2,1531,881(272)
Taxesother than income.......................................................... 1,095 1,019 (76)
Total other operatingexpenses ................................................. 10,51810,861343
33