ComEd 2013 Annual Report Download - page 79
Download and view the complete annual report
Please find page 79 of the 2013 ComEd annual report below. You can navigate through the pages in the report by either clicking on the pages listed below, or by using the keyword search tool below to find specific information within the annual report.-
 1
1 -
2
-
3
-
4
-
5
-
6
-
7
-
8
-
9
-
10
-
11
-
12
-
13
-
14
-
15
-
16
-
17
-
18
-
19
-
20
-
21
-
22
-
23
-
24
-
25
-
26
-
27
-
28
-
29
-
30
-
31
-
32
-
33
-
34
-
35
-
36
-
37
-
38
-
39
-
40
-
41
-
42
-
43
-
44
-
45
-
46
-
47
-
48
-
49
-
50
-
51
-
52
-
53
-
54
-
55
-
56
-
57
-
58
-
59
-
60
-
61
-
62
-
63
-
64
-
65
-
66
-
67
-
68
-
 69
69 -
 70
70 -
 71
71 -
 72
72 -
 73
73 -
 74
74 -
 75
75 -
 76
76 -
 77
77 -
 78
78 -
 79
79 -
 80
80 -
 81
81 -
 82
82 -
 83
83 -
 84
84 -
 85
85 -
 86
86 -
 87
87 -
 88
88 -
 89
89 -
90
-
91
-
92
-
93
-
94
-
95
-
96
-
97
-
98
-
99
-
100
-
101
-
102
-
103
-
104
-
105
-
106
-
107
-
108
-
109
-
110
-
111
-
112
-
113
-
114
-
115
-
116
-
117
-
118
-
119
-
120
-
121
-
122
-
123
-
124
-
125
-
126
-
127
-
128
-
129
-
130
-
131
-
132
-
133
-
134
-
135
-
136
-
137
-
138
-
139
-
140
-
141
-
142
-
143
-
144
-
145
-
146
-
147
-
148
-
149
-
150
-
151
-
152
-
153
-
154
-
155
-
156
-
157
-
158
-
159
-
160
-
161
-
162
-
163
-
164
-
165
-
166
-
167
-
168
-
169
-
170
-
171
-
172
-
173
-
174
-
175
-
176
-
177
-
178
-
179
-
180
-
181
-
182
-
183
-
184
-
185
-
186
-
187
-
188
-
189
-
190
-
191
-
192
-
193
-
194
-
195
-
196
-
197
-
198
-
199
-
200
-
201
-
202
-
203
-
204
-
205
-
206
-
207
-
208
-
209
-
210
-
211
-
212
-
213
-
214
-
215
-
216
-
217
-
218
-
219
-
220
-
221
-
222
-
223
-
224
-
225
-
226
-
227
-
228
-
229
-
230
-
231
-
232
-
233
-
234
-
235
-
236
-
237
-
238
-
239
-
240
-
241
-
242
-
243
-
244
-
245
-
246
-
247
-
248
-
249
-
250
-
251
-
252
-
253
-
254
-
255
-
256
-
257
-
258
-
259
-
260
 |
 |

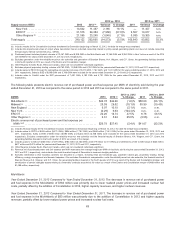
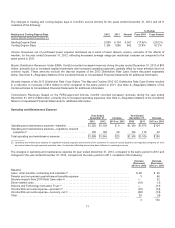
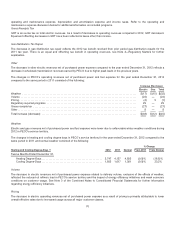
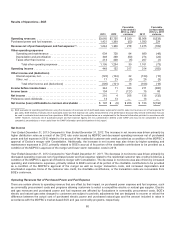
Other, Net
Thechangesinother,net for 2013 comparedto 2012 and2012 comparedto 2011 consistedofthefollowing:
Increase
(Decrease)
2013 vs. 2012
Increase
(Decrease)
2012 vs. 2011
Interestincome relatedto uncertaintaxpositions(a).......................................... $(20)$16
Gainonasset disposal .................................................................. 5 —
Other ................................................................................ 2(6)
IncreaseinOther,net ................................................................... $(13)$10
(a)Primarilyreflectsareceivable recordedinthefourthquarter of2012 relatedto thefinal 1999-2001 IRSsettlement.
Effective Income Tax Rate
ComEd’s effectiveincometaxratesfor theyearsendedDecember 31,2013,2012 and2011,were 37.9%, 38.7% and37.5%,
respectively. See Note 14—IncomeTaxesoftheCombinedNotesto ConsolidatedFinancial Statementsfor additional information
regardingthecomponentsoftheeffectiveincometaxrates.
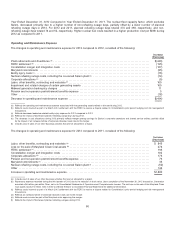
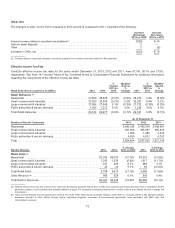
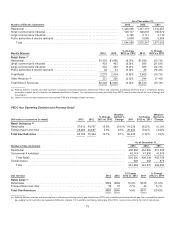
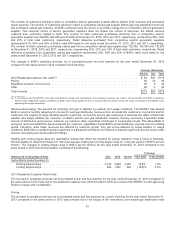
Retail Deliveries to customers (in GWhs) 2013 2012
%
Change
2013 vs
2012
Weather-
Normal
%
Change 2011
%
Change
2012 vs
2011
Weather-
Normal
%
Change
Retail Deliveries (a)
Residential ............................................ 27,800 28,528(2.6)% (0.6)% 28,2730.9% (0.6)%
Small commercial &industrial ............................. 32,30532,534(0.7)% 0.2%32,2810.8% 0.2%
Largecommercial &industrial ............................. 27,684 27,6430.1%(0.3)% 27,732 (0.3)% (0.3)%
Public authorities&electric railroads ....................... 1,355 1,2726.5% 4.2%1,2353.0%4.2%
Total RetailDeliveries ................................... 89,144 89,977 (0.9)% (0.1)% 89,521 0.5% (0.1)%
As of December 31,
Number of Electric Customers 2013 2012 2011
Residential ..................................................................... 3,480,398 3,455,546 3,448,481
Small commercial &industrial ..................................................... 367,569 365,357 365,824
Largecommercial &industrial ..................................................... 1,984 1,9802,032
Public authorities&electric railroads................................................ 4,8534,812 4,797
Total .......................................................................... 3,854,8043,827,695 3,821,134
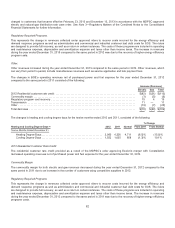
Electric Revenue 2013 2012
% Change
2013 vs 2012 2011
% Change
2012 vs 2011
Retail Sales (a)
Residential .................................................... $2,073$3,037(31.7)% $3,510 (13.5)%
Small commercial &industrial ..................................... 1,2501,339 (6.6)% 1,517(11.7)%
Largecommercial &industrial ..................................... 427395 8.1%3833.1%
Public authorities&electric railroads ............................... 48 44 9.1%50(12.0)%
Total RetailSales............................................... 3,798 4,815(21.1)% 5,460(11.8)%
Other Revenue (b) ............................................... 666 6286.1% 596 5.4%
Total Electric Revenues.......................................... $4,464 $5,443(18.0)% $6,056 (10.1)%
(a)ReflectsdeliveryrevenuesandvolumesfromcustomerspurchasingelectricitydirectlyfromComEd andcustomerspurchasingelectricityfromacompetitive electric
generation supplier,asall customersare assesseddeliverycharges. For customerspurchasingelectricityfromComEd, revenue alsoreflectsthecostofenergy and
transmission.
(b) Other revenue primarilyincludestransmission revenue from PJM. Other items includewholesale revenue,rental revenue,revenuesrelatedto late payment charges,
assistance providedto other utilitiesthrough mutual assistance programs, recoveriesofenvironmental remediation costsassociatedwith MGP sites, and
intercompanyrevenues.
73