ComEd 2013 Annual Report Download - page 188
Download and view the complete annual report
Please find page 188 of the 2013 ComEd annual report below. You can navigate through the pages in the report by either clicking on the pages listed below, or by using the keyword search tool below to find specific information within the annual report.-
 1
1 -
2
-
3
-
4
-
5
-
6
-
7
-
8
-
9
-
10
-
11
-
12
-
13
-
14
-
15
-
16
-
17
-
18
-
19
-
20
-
21
-
22
-
23
-
24
-
25
-
26
-
27
-
28
-
29
-
30
-
31
-
32
-
33
-
34
-
35
-
36
-
37
-
38
-
39
-
40
-
41
-
42
-
43
-
44
-
45
-
46
-
47
-
48
-
49
-
50
-
51
-
52
-
53
-
54
-
55
-
56
-
57
-
58
-
59
-
60
-
61
-
62
-
63
-
64
-
65
-
66
-
67
-
68
-
69
-
70
-
71
-
72
-
73
-
74
-
75
-
76
-
77
-
78
-
79
-
80
-
81
-
82
-
83
-
84
-
85
-
86
-
87
-
88
-
89
-
90
-
91
-
92
-
93
-
94
-
95
-
96
-
97
-
98
-
99
-
100
-
101
-
102
-
103
-
104
-
105
-
106
-
107
-
108
-
109
-
110
-
111
-
112
-
113
-
114
-
115
-
116
-
117
-
118
-
119
-
120
-
121
-
122
-
123
-
124
-
125
-
126
-
127
-
128
-
129
-
130
-
131
-
132
-
133
-
134
-
135
-
136
-
137
-
138
-
139
-
140
-
141
-
142
-
143
-
144
-
145
-
146
-
147
-
148
-
149
-
150
-
151
-
152
-
153
-
154
-
155
-
156
-
157
-
158
-
159
-
160
-
161
-
162
-
163
-
164
-
165
-
166
-
167
-
168
-
169
-
170
-
171
-
172
-
173
-
174
-
175
-
176
-
177
-
 178
178 -
 179
179 -
 180
180 -
 181
181 -
 182
182 -
 183
183 -
 184
184 -
 185
185 -
 186
186 -
 187
187 -
 188
188 -
 189
189 -
 190
190 -
 191
191 -
 192
192 -
 193
193 -
 194
194 -
 195
195 -
 196
196 -
 197
197 -
 198
198 -
199
-
200
-
201
-
202
-
203
-
204
-
205
-
206
-
207
-
208
-
209
-
210
-
211
-
212
-
213
-
214
-
215
-
216
-
217
-
218
-
219
-
220
-
221
-
222
-
223
-
224
-
225
-
226
-
227
-
228
-
229
-
230
-
231
-
232
-
233
-
234
-
235
-
236
-
237
-
238
-
239
-
240
-
241
-
242
-
243
-
244
-
245
-
246
-
247
-
248
-
249
-
250
-
251
-
252
-
253
-
254
-
255
-
256
-
257
-
258
-
259
-
260
 |
 |

Credit Risk
TheRegistrantswouldbeexposedto credit-relatedlossesintheevent ofnon-performanceby counterpartiesthat enter into
derivativeinstruments. Thecreditexposure ofderivativecontracts, before collateral,isrepresentedbythefairvalue ofcontractsat
the reportingdate.For energy-relatedderivativeinstruments, Generation entersinto enablingagreementsthat allowfor payment
nettingwithitscounterparties, which reducesGeneration’s exposure to counterpartyrisk by providingfor theoffset ofamounts
payable to thecounterpartyagainstamountsreceivable fromthecounterparty. Typically, each enablingagreement is for a specific
commodityandso,withrespecttoeach individual counterparty, nettingislimitedto transactionsinvolvingthat specific commodity
product,except where master nettingagreementsexistwithacounterpartythat allowfor cross product netting. Inaddition to
payment nettinglanguageinthe enablingagreement,Generation’s creditdepartment establishescreditlimits, marginingthresholds
andcollateral requirementsfor each counterparty, which are definedinthederivativecontracts. Counterpartycreditlimitsare based
on an internal creditreviewprocess that considersavarietyoffactors, includingtheresultsofascoringmodel,leverage,liquidity,
profitability, credit ratings by credit ratingagencies, andrisk management capabilities. Totheextent that a counterparty’s margining
thresholds are exceeded, thecounterpartyisrequiredto postcollateral withGeneration asspecifiedineach enablingagreement.
Generation’s creditdepartment monitorscurrent andforwardcreditexposure to counterpartiesandtheiraffiliates, bothon an
individual andan aggregate basis.
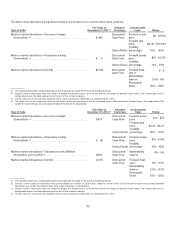
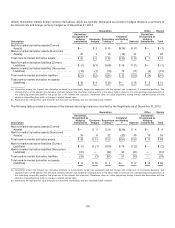
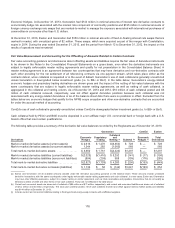
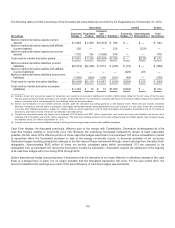
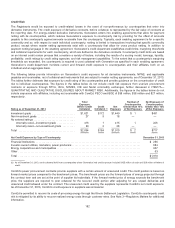
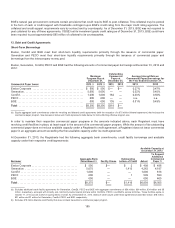
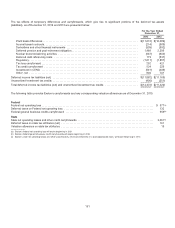
Thefollowingtablesprovideinformation on Generation’s creditexposure for all derivativeinstruments, NPNS, andapplicable
payablesandreceivables, net ofcollateral andinstrumentsthat are subjecttomaster nettingagreements, asofDecember 31,2013.
Thetablesfurther delineate that exposure by credit ratingofthecounterpartiesandprovideguidanceontheconcentration ofcredit
risk to individual counterparties. Thefiguresinthetablesbelowdo not includecreditrisk exposure fromuraniumprocurement
contractsor exposure through RTOs, ISOs, NYMEX, ICE andNodal commodityexchanges, further discussedinITEM 7A—
QUANTITATIVE AND QUALITATIVE DISCLOSURES ABOUT MARKET RISK. Additionally, thefiguresinthetablesbelowdo not
includeexposureswithaffiliates, includingnet receivableswithComEd, PECO and BGE of$38million,$38million and$27million,
respectively.
Rating as of December 31, 2013
Total
Exposure
Before Credit
Collateral
Credit
Collateral (a)
Net
Exposure
Number of
Counterparties
Greater than 10%
of Net Exposure
Net Exposure of
Counterparties
Greater than 10%
of Net Exposure
Investment grade............................... $1,621 $172$1,449 $ 1$491
Non-investment grade........................... 27918— —
Noexternal ratings ..............................
Internallyrated—investment grade............. 41614151226
Internallyrated—non-investment grade......... 30 2 28— —
Total ......................................... $2,094 $184 $1,910 $2$717
Net Credit Exposure by Type of Counterparty December 31, 2013
Financial Institutions ............................................................................ $ 256
Investor-ownedutilities, marketers, power producers.................................................. 684
Energy cooperativesandmunicipalities............................................................. 907
Other ......................................................................................... 63
Total ......................................................................................... $1,910
(a)AsofDecember 31,2013,creditcollateral heldfromcounterpartieswhere Generation hadcreditexposure included$155 million ofcash and$29million oflettersof
credit.
ComEd’s power procurement contractsprovidesupplierswithacertainamount ofunsecuredcredit.Thecreditposition is basedon
forwardmarket pricescomparedto thebenchmarkprices. Thebenchmarkpricesare theforwardpricesofenergy projectedthrough
thecontract termandare set at thepoint ofsupplier bid submittals. If theforwardmarket priceofenergy exceeds thebenchmark
price,thesuppliersare requiredto postcollateral for thesecuredcredit portion after adjustingfor anyunpaid deliveriesand
unsecuredcredit allowedunder thecontract.TheunsecuredcreditusedbythesuppliersrepresentsComEd’s net creditexposure.
AsofDecember 31,2013,ComEd’s creditexposure to supplierswas immaterial.
ComEd is permittedto recover itscostsofprocuringenergy through theIllinois Settlement Legislation.ComEd’s counterpartycredit
risk is mitigatedbyitsabilityto recover realizedenergy coststhrough customer rates. See Note 3—RegulatoryMattersfor additional
information.
182