ComEd 2013 Annual Report Download - page 209
Download and view the complete annual report
Please find page 209 of the 2013 ComEd annual report below. You can navigate through the pages in the report by either clicking on the pages listed below, or by using the keyword search tool below to find specific information within the annual report.-
 1
1 -
2
-
3
-
4
-
5
-
6
-
7
-
8
-
9
-
10
-
11
-
12
-
13
-
14
-
15
-
16
-
17
-
18
-
19
-
20
-
21
-
22
-
23
-
24
-
25
-
26
-
27
-
28
-
29
-
30
-
31
-
32
-
33
-
34
-
35
-
36
-
37
-
38
-
39
-
40
-
41
-
42
-
43
-
44
-
45
-
46
-
47
-
48
-
49
-
50
-
51
-
52
-
53
-
54
-
55
-
56
-
57
-
58
-
59
-
60
-
61
-
62
-
63
-
64
-
65
-
66
-
67
-
68
-
69
-
70
-
71
-
72
-
73
-
74
-
75
-
76
-
77
-
78
-
79
-
80
-
81
-
82
-
83
-
84
-
85
-
86
-
87
-
88
-
89
-
90
-
91
-
92
-
93
-
94
-
95
-
96
-
97
-
98
-
99
-
100
-
101
-
102
-
103
-
104
-
105
-
106
-
107
-
108
-
109
-
110
-
111
-
112
-
113
-
114
-
115
-
116
-
117
-
118
-
119
-
120
-
121
-
122
-
123
-
124
-
125
-
126
-
127
-
128
-
129
-
130
-
131
-
132
-
133
-
134
-
135
-
136
-
137
-
138
-
139
-
140
-
141
-
142
-
143
-
144
-
145
-
146
-
147
-
148
-
149
-
150
-
151
-
152
-
153
-
154
-
155
-
156
-
157
-
158
-
159
-
160
-
161
-
162
-
163
-
164
-
165
-
166
-
167
-
168
-
169
-
170
-
171
-
172
-
173
-
174
-
175
-
176
-
177
-
178
-
179
-
180
-
181
-
182
-
183
-
184
-
185
-
186
-
187
-
188
-
189
-
190
-
191
-
192
-
193
-
194
-
195
-
196
-
197
-
198
-
 199
199 -
 200
200 -
 201
201 -
 202
202 -
 203
203 -
 204
204 -
 205
205 -
 206
206 -
 207
207 -
 208
208 -
 209
209 -
 210
210 -
 211
211 -
 212
212 -
 213
213 -
 214
214 -
 215
215 -
 216
216 -
 217
217 -
 218
218 -
 219
219 -
220
-
221
-
222
-
223
-
224
-
225
-
226
-
227
-
228
-
229
-
230
-
231
-
232
-
233
-
234
-
235
-
236
-
237
-
238
-
239
-
240
-
241
-
242
-
243
-
244
-
245
-
246
-
247
-
248
-
249
-
250
-
251
-
252
-
253
-
254
-
255
-
256
-
257
-
258
-
259
-
260
 |
 |

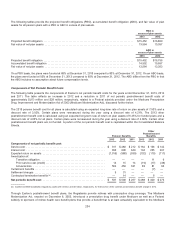
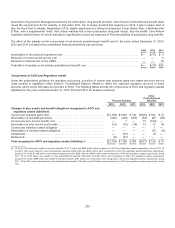
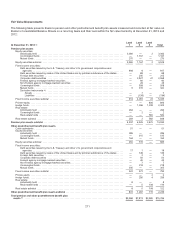
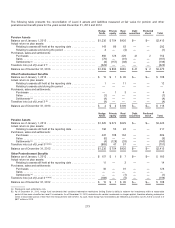
Thefollowingtable providesa rollforwardofthechangesinthebenefitobligationsandplan assetsfor themostrecent twoyearsfor
all planscombined:
Pension Benefits
Other
Postretirement Benefits
2013 2012 2013 2012
Changeinbenefitobligation:
Net benefitobligation at beginningofyear ..................................... $16,800 $13,538 $4,820 $4,062
Servicecost............................................................. 317280162156
Interestcost............................................................. 650698 194 205
Plan participants’ contributions .............................................. — — 3434
Actuarial loss (gain) ....................................................... (1,363)1,520 (551)313
Plan amendments ........................................................ 1—15(103)
Acquisitions/divestitures ................................................... — 1,880—362
Curtailments ............................................................. — (10) — (8)
Settlements(a)............................................................ (69) (169) — —
Contractual termination benefits ............................................. — 15— 6
Gross benefitspaid ....................................................... (877) (952)(223)(219)
Federal subsidy on benefitspaid ............................................ — — — 12
Net benefitobligation at endofyear .......................................... $15,459 $16,800 $4,451$4,820
Changein plan assets:
Fairvalue ofnet plan assetsat beginningofyear ............................... $13,357 $11,302 $2,135$1,797
Actual return on plan assets ................................................ 821 1,484 209197
Employer contributions .................................................... 339149 83325
Plan participants’ contributions .............................................. — — 3434
Benefitspaid (b) ........................................................... (877) (952)(223)(218)
Acquisitions/divestitures ................................................... — 1,543——
Settlements(a)............................................................ (69) (169) — —
Fairvalue ofnet plan assetsat endofyear .................................... $13,571$13,357 $2,238$2,135
(a)Representscash settlementsonly.
(b) Exelon’s other postretirement benefitspaid for theyear endedDecember 31,2012 are net of$1.3million ofreinsurance proceeds receivedfromtheDepartment of
HealthandHuman Servicesaspart oftheEarlyRetiree ReinsuranceProgrampursuant to theAffordable Care Actof2010.In 2013,theProgramwasno longer
acceptingapplicationsfor reimbursement.
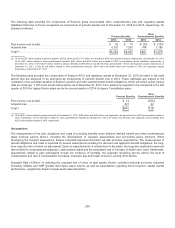
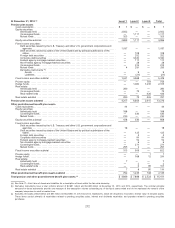
Exelon presentsitsbenefitobligationsandplan assetsnet on itsbalancesheet withinthefollowingline items:
Pension
Benefits
Other
Postretirement Benefits
2013 2012 2013 2012
Other current liabilities ...................................................... $ 12 $15$23 $23
Pension obligations ......................................................... 1,876 3,428— —
Non-pension postretirement benefitobligations .................................. — — 2,1902,662
Unfundedstatus(net benefitobligation less net plan assets) ....................... $1,888 $3,443$2,213 $2,685
Thefundedstatusofthe pension andother postretirement benefitobligationsrefersto thedifferencebetween plan assetsand
estimatedobligationsofthe plan.Thefundedstatuschangesover timedue to several factors, includingcontribution levels, assumed
discount ratesandactual returnson plan assets.
203