ComEd 2013 Annual Report Download - page 71
Download and view the complete annual report
Please find page 71 of the 2013 ComEd annual report below. You can navigate through the pages in the report by either clicking on the pages listed below, or by using the keyword search tool below to find specific information within the annual report.-
 1
1 -
2
-
3
-
4
-
5
-
6
-
7
-
8
-
9
-
10
-
11
-
12
-
13
-
14
-
15
-
16
-
17
-
18
-
19
-
20
-
21
-
22
-
23
-
24
-
25
-
26
-
27
-
28
-
29
-
30
-
31
-
32
-
33
-
34
-
35
-
36
-
37
-
38
-
39
-
40
-
41
-
42
-
43
-
44
-
45
-
46
-
47
-
48
-
49
-
50
-
51
-
52
-
53
-
54
-
55
-
56
-
57
-
58
-
59
-
60
-
 61
61 -
 62
62 -
 63
63 -
 64
64 -
 65
65 -
 66
66 -
 67
67 -
 68
68 -
 69
69 -
 70
70 -
 71
71 -
 72
72 -
 73
73 -
 74
74 -
 75
75 -
 76
76 -
 77
77 -
 78
78 -
 79
79 -
 80
80 -
 81
81 -
82
-
83
-
84
-
85
-
86
-
87
-
88
-
89
-
90
-
91
-
92
-
93
-
94
-
95
-
96
-
97
-
98
-
99
-
100
-
101
-
102
-
103
-
104
-
105
-
106
-
107
-
108
-
109
-
110
-
111
-
112
-
113
-
114
-
115
-
116
-
117
-
118
-
119
-
120
-
121
-
122
-
123
-
124
-
125
-
126
-
127
-
128
-
129
-
130
-
131
-
132
-
133
-
134
-
135
-
136
-
137
-
138
-
139
-
140
-
141
-
142
-
143
-
144
-
145
-
146
-
147
-
148
-
149
-
150
-
151
-
152
-
153
-
154
-
155
-
156
-
157
-
158
-
159
-
160
-
161
-
162
-
163
-
164
-
165
-
166
-
167
-
168
-
169
-
170
-
171
-
172
-
173
-
174
-
175
-
176
-
177
-
178
-
179
-
180
-
181
-
182
-
183
-
184
-
185
-
186
-
187
-
188
-
189
-
190
-
191
-
192
-
193
-
194
-
195
-
196
-
197
-
198
-
199
-
200
-
201
-
202
-
203
-
204
-
205
-
206
-
207
-
208
-
209
-
210
-
211
-
212
-
213
-
214
-
215
-
216
-
217
-
218
-
219
-
220
-
221
-
222
-
223
-
224
-
225
-
226
-
227
-
228
-
229
-
230
-
231
-
232
-
233
-
234
-
235
-
236
-
237
-
238
-
239
-
240
-
241
-
242
-
243
-
244
-
245
-
246
-
247
-
248
-
249
-
250
-
251
-
252
-
253
-
254
-
255
-
256
-
257
-
258
-
259
-
260
 |
 |

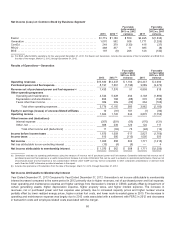
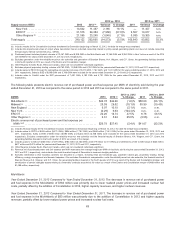
Mark-to-market
Year Ended December 31, 2013 Compared to Year Ended December 31, 2012.Generation is exposedto market risks associated
withchangesincommoditypricesandentersinto economic hedgesto mitigate exposure to thesefluctuations. Mark-to-market gains
on economic hedgingactivitieswere $504million in 2013 comparedto gainsof$515million in 2012.See Notes11 and12 ofthe
CombinedNotesto theConsolidatedFinancial Statementsfor information on gainsandlossesassociatedwithmark-to-market
derivatives.
Year Ended December 31, 2012 Compared to Year Ended December 31, 2011.Generation is exposedto market risks associated
withchangesincommoditypricesandentersinto economic hedgesto mitigate exposure to thesefluctuations. Mark-to-market gains
on economic hedgingactivitieswere $515million in 2012 comparedto lossesof$288 million in 2011.See Note 11 and12 ofthe
CombinedNotesto theConsolidatedFinancial Statementsfor information on gainsandlossesassociatedwithmark-to-market
derivatives.
Other
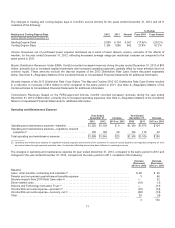
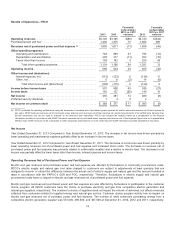
Year Ended December 31, 2013 Compared to Year Ended December 31, 2012. The$627million increaseinother revenue net of
purchasedpower andfuel wasprimarilydue to reducedamortization expenseoftheacquiredenergy contractsrecordedat fairvalue
at themerger date.Inaddition,theincreaseis also attributable to resultsfromactivitiesacquiredaspart ofthe 2012 merger with
Constellation includingretailgas, energy efficiency, energy management anddemandresponse,upstreamnatural gas, andthe
designandconstruction ofrenewable energy facilities. Theseincreaseswere partiallyoffset by thereduction inrevenuesnet of
purchasedpower andfuel expensefromthesale ofBrandon Shores, H.A.Wagner and C.P. Crane,thegeneratingfacilities divested
inthefourthquarter of2012 asaresult oftheExelon andConstellation merger.See Note 4oftheCombinedNotesto Consolidated
Financial Statementsfor information regardingcontractintangiblesandassetsplannedfor divestiture asaresult oftheConstellation
merger.
Year Ended December 31, 2012 Compared to Year Ended December 31, 2011. The$510 million decreaseinother revenue net of
purchasedpower andfuel wasprimarilydue to increasedamortization expenseoftheacquiredenergy contractsrecordedat fair
value at themerger date. This decreasewaspartiallyoffset by resultsfromactivitiesacquiredaspart ofthe 2012 merger with
Constellation includingretailgas, energy efficiency, energy management anddemandresponse,upstreamnatural gasandthe
designandconstruction ofrenewable energy facilities. Inaddition,other revenue net ofpurchasedpower andfuel includesthe
resultsofBrandon Shores, H.A.Wagner and C.P. Crane,thegeneratingfacilities divestedinfourthquarter of2012 asaresult ofthe
Exelon andConstellation merger.See Note 4oftheCombinedNotesto ConsolidatedFinancial Statementsfor information regarding
contractintangiblesandassetsplannedfor divestiture asaresult oftheConstellation merger.
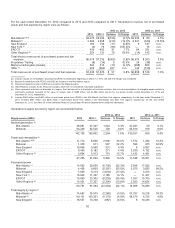
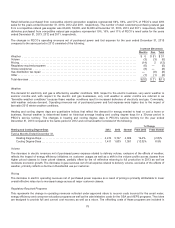
Nuclear Fleet Capacity Factor and Production Costs
Thefollowingtable presentsnuclear fleet operatingdata for 2013,ascomparedto 2012 and2011,for theGeneration-operated
plants. Thenuclear fleet capacityfactor presentedinthetable is definedasthe ratiooftheactual output ofa plant over a periodof
timetoitsoutput if the plant hadoperatedat full average annual mean capacityfor that time period. Nuclear fleet production costis
definedasthecoststo produce one MWh ofenergy, includingfuel,materials, labor,contractingandother miscellaneouscosts, but
excludesdepreciation andcertainother non-production relatedoverheadcosts. Generation considerscapacityfactor andproduction
costsuseful measuresto analyzethenuclear fleet performancebetween periods. Generation hasincludedthe analysis belowasa
complement to thefinancial information providedinaccordancewithGAAP. However,thesemeasuresare not a presentation
definedunder GAAPandmaynot becomparable to other companies’ presentationsor bemore useful than theGAAPinformation
providedelsewhere inthis report.
2013 2012 2011
Nuclear fleet capacityfactor (a)............................................................. 94.1%92.7% 93.3%
Nuclear fleet production cost per MWh (a)..................................................... $19.83$19.50$18.86
(a) ExcludesSalem, which is operated by PSEG Nuclear, LLC, and CENG’s nuclear facilities, which are operated by CENG. Reflectsownership percentageofstations
operatedbyExelon.
Year Ended December 31, 2013 Compared to Year Ended December 31, 2012.Thenuclear fleet capacityfactor, which excludes
Salem, increasedprimarilydue to a lower number ofplannedrefuelingoutagedays in 2013,partiallyoffset by ahigher number of
non-refuelingoutagedays. For 2013 and2012,plannedrefuelingoutagedays totaled233 and274, respectively, andnon-refueling
outagedays totaled75and73,respectively. Higher nuclear fuel costsand higher plant operatingandmaintenancecosts, partially
offset by higher number ofnet MWhs generatedresultedinahigher production cost per MWh during2013 ascomparedto 2012.
65