ComEd 2013 Annual Report Download - page 67
Download and view the complete annual report
Please find page 67 of the 2013 ComEd annual report below. You can navigate through the pages in the report by either clicking on the pages listed below, or by using the keyword search tool below to find specific information within the annual report.-
 1
1 -
2
-
3
-
4
-
5
-
6
-
7
-
8
-
9
-
10
-
11
-
12
-
13
-
14
-
15
-
16
-
17
-
18
-
19
-
20
-
21
-
22
-
23
-
24
-
25
-
26
-
27
-
28
-
29
-
30
-
31
-
32
-
33
-
34
-
35
-
36
-
37
-
38
-
39
-
40
-
41
-
42
-
43
-
44
-
45
-
46
-
47
-
48
-
49
-
50
-
51
-
52
-
53
-
54
-
55
-
56
-
 57
57 -
 58
58 -
 59
59 -
 60
60 -
 61
61 -
 62
62 -
 63
63 -
 64
64 -
 65
65 -
 66
66 -
 67
67 -
 68
68 -
 69
69 -
 70
70 -
 71
71 -
 72
72 -
 73
73 -
 74
74 -
 75
75 -
 76
76 -
 77
77 -
78
-
79
-
80
-
81
-
82
-
83
-
84
-
85
-
86
-
87
-
88
-
89
-
90
-
91
-
92
-
93
-
94
-
95
-
96
-
97
-
98
-
99
-
100
-
101
-
102
-
103
-
104
-
105
-
106
-
107
-
108
-
109
-
110
-
111
-
112
-
113
-
114
-
115
-
116
-
117
-
118
-
119
-
120
-
121
-
122
-
123
-
124
-
125
-
126
-
127
-
128
-
129
-
130
-
131
-
132
-
133
-
134
-
135
-
136
-
137
-
138
-
139
-
140
-
141
-
142
-
143
-
144
-
145
-
146
-
147
-
148
-
149
-
150
-
151
-
152
-
153
-
154
-
155
-
156
-
157
-
158
-
159
-
160
-
161
-
162
-
163
-
164
-
165
-
166
-
167
-
168
-
169
-
170
-
171
-
172
-
173
-
174
-
175
-
176
-
177
-
178
-
179
-
180
-
181
-
182
-
183
-
184
-
185
-
186
-
187
-
188
-
189
-
190
-
191
-
192
-
193
-
194
-
195
-
196
-
197
-
198
-
199
-
200
-
201
-
202
-
203
-
204
-
205
-
206
-
207
-
208
-
209
-
210
-
211
-
212
-
213
-
214
-
215
-
216
-
217
-
218
-
219
-
220
-
221
-
222
-
223
-
224
-
225
-
226
-
227
-
228
-
229
-
230
-
231
-
232
-
233
-
234
-
235
-
236
-
237
-
238
-
239
-
240
-
241
-
242
-
243
-
244
-
245
-
246
-
247
-
248
-
249
-
250
-
251
-
252
-
253
-
254
-
255
-
256
-
257
-
258
-
259
-
260
 |
 |

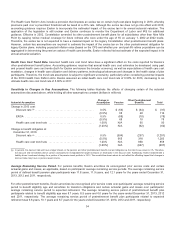
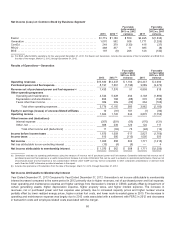
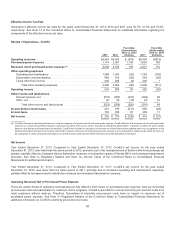
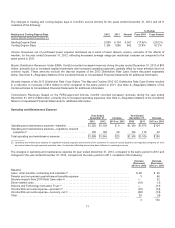
Year Ended December 31, 2012 Compared to Year Ended December 31, 2011. Generation’s net income attributable to membership
interestdecreasedcomparedto thesame periodin 2012 primarilydue to higher operatingexpenses, theloss on thesale ofBrandon
Shores, Wagner and C.P. Crane (collectivelyMarylandgeneratingstations) andtheamortization ofacquiredenergy contracts
recordedat fairvalue at themerger date;offset by higher revenues, net ofpurchasedpower andfuel expenseandfavorable NDT
fundperformance.Theincreasein operatingexpenseswasdue to theaddition ofConstellation’s financial resultsfromMarch 12,
2012,costsrelatedto a 2012 settlement withFERCandtransaction andemployee-relatedseverancecostsassociatedwiththe
merger.Theincreaseinrevenues, net ofpurchasedpower andfuel expensewasalsoprimarilydue to themerger.See Note 4for
additional information regardingtheloss on thesale ofthree Marylandgeneratingstations.
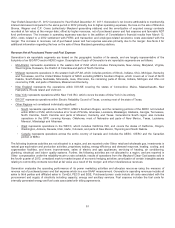
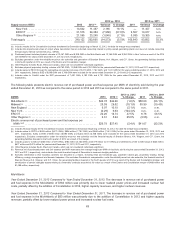
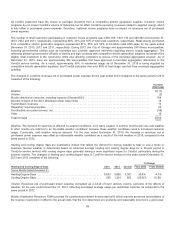
Revenue Net of Purchased Power and Fuel Expense
Generation’s six reportable segmentsare basedon thegeographic location ofitsassets, andare largelyrepresentativeofthe
footprintsofan ISO/RTO and/or NERCregion.Descriptionsofeach ofGeneration’s six reportable segmentsare asfollows:
• Mid-Atlantic representsoperationsintheeastern halfof PJM, which includesPennsylvania,NewJersey, Maryland, Virginia,
WestVirginia,Delaware,theDistrictofColumbiaandpartsofNorthCarolina.
• Midwest representsoperationsinthewestern halfof PJM, which includesportionsofIllinois, Indiana, Ohio, Michigan,Kentucky
andTennessee,andtheUnitedStatesfootprint of MISO excluding MISO’s Southern Region, which coversall or mostofNorth
Dakota,SouthDakota,Nebraska,Minnesota,Iowa, Wisconsin,theremainingpartsofIllinois, Indiana, Michigan and Ohio not
covered by PJM, andpartsofMontana, MissouriandKentucky.
•NewEnglandrepresentsthe operationswithinISO-NE coveringthestatesofConnecticut,Maine,Massachusetts, New
Hampshire,RhodeIslandandVermont.
• NewYorkrepresentsoperationswithinNewYork ISO, which coversthestate ofNewYorkinitsentirety.
•ERCOT representsoperationswithinElectric ReliabilityCouncilofTexas, coveringmostofthestate ofTexas.
•Other Regionsnot consideredindividually significant:
•SouthrepresentsoperationsintheFRCC, MISO’s Southern Region,andtheremainingportionsoftheSERCnot included
withinMISO or PJM, which includesall or mostofFlorida,Arkansas, Louisiana, Mississippi, Alabama,Georgia,Tennessee,
NorthCarolina,SouthCarolina andpartsof Missouri, Kentucky andTexas. Generation’s Southregion alsoincludes
operationsintheSPP, coveringKansas, Oklahoma,mostofNebraskaandpartsofNewMexico,Texas, Louisiana,
Missouri, MississippiandArkansas.
•West representsoperationsintheWECC, which includesCaliforniaISO, andcoversthestatesofCalifornia,Oregon,
Washington,Arizona,Nevada,Utah, Idaho,Colorado,andpartsofNewMexico,WyomingandSouthDakota.
• Canada representsoperationsacross the entire countryofCanadaandincludestheAESO, OIESO andtheCanadian
portion of MISO.
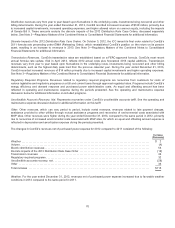
Thefollowingbusiness activitiesare not allocatedto a region,andare reportedunder Other:retailandwholesale gas, investmentsin
natural gasexploration andproduction activities, proprietarytrading, energy efficiency anddemandresponse,heating, cooling, and
cogeneration facilities, andhomeimprovements, salesofelectric andgasappliances, servicingofheating, airconditioning,
plumbing, electrical,andindoor quality systems. Further,thefollowingactivitiesare not allocatedto a region,andare reportedin
Other:compensation under the reliability-must-run rate schedule;resultsofoperationsfromtheMarylandClean-Coal assetssoldin
thefourthquarter of2012;unrealizedmark-to-market impactofeconomic hedgingactivities; amortization ofcertainintangible assets
relatingto commoditycontractsrecordedat fairvalue asaresult ofthemerger;andother miscellaneousrevenues.
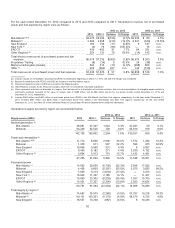
Generation evaluatesthe operatingperformanceofitspower marketingactivitiesandallocatesresourcesusingthemeasure of
revenue net ofpurchasedpower andfuel expensewhich is a non-GAAPmeasurement.Generation’s operatingrevenuesinclude all
salesto thirdpartiesandaffiliatedsalesto ComEd, PECO and BGE. Purchasedpower costsinclude all costsassociatedwiththe
procurement andsupplyofelectricityincludingcapacity, energy andancillaryservices. Fuel expenseincludesthefuel costsfor
internallygeneratedenergy andfuel costsassociatedwithtollingagreements.
61