ComEd 2013 Annual Report Download - page 226
Download and view the complete annual report
Please find page 226 of the 2013 ComEd annual report below. You can navigate through the pages in the report by either clicking on the pages listed below, or by using the keyword search tool below to find specific information within the annual report.-
 1
1 -
2
-
3
-
4
-
5
-
6
-
7
-
8
-
9
-
10
-
11
-
12
-
13
-
14
-
15
-
16
-
17
-
18
-
19
-
20
-
21
-
22
-
23
-
24
-
25
-
26
-
27
-
28
-
29
-
30
-
31
-
32
-
33
-
34
-
35
-
36
-
37
-
38
-
39
-
40
-
41
-
42
-
43
-
44
-
45
-
46
-
47
-
48
-
49
-
50
-
51
-
52
-
53
-
54
-
55
-
56
-
57
-
58
-
59
-
60
-
61
-
62
-
63
-
64
-
65
-
66
-
67
-
68
-
69
-
70
-
71
-
72
-
73
-
74
-
75
-
76
-
77
-
78
-
79
-
80
-
81
-
82
-
83
-
84
-
85
-
86
-
87
-
88
-
89
-
90
-
91
-
92
-
93
-
94
-
95
-
96
-
97
-
98
-
99
-
100
-
101
-
102
-
103
-
104
-
105
-
106
-
107
-
108
-
109
-
110
-
111
-
112
-
113
-
114
-
115
-
116
-
117
-
118
-
119
-
120
-
121
-
122
-
123
-
124
-
125
-
126
-
127
-
128
-
129
-
130
-
131
-
132
-
133
-
134
-
135
-
136
-
137
-
138
-
139
-
140
-
141
-
142
-
143
-
144
-
145
-
146
-
147
-
148
-
149
-
150
-
151
-
152
-
153
-
154
-
155
-
156
-
157
-
158
-
159
-
160
-
161
-
162
-
163
-
164
-
165
-
166
-
167
-
168
-
169
-
170
-
171
-
172
-
173
-
174
-
175
-
176
-
177
-
178
-
179
-
180
-
181
-
182
-
183
-
184
-
185
-
186
-
187
-
188
-
189
-
190
-
191
-
192
-
193
-
194
-
195
-
196
-
197
-
198
-
199
-
200
-
201
-
202
-
203
-
204
-
205
-
206
-
207
-
208
-
209
-
210
-
211
-
212
-
213
-
214
-
215
-
 216
216 -
 217
217 -
 218
218 -
 219
219 -
 220
220 -
 221
221 -
 222
222 -
 223
223 -
 224
224 -
 225
225 -
 226
226 -
 227
227 -
 228
228 -
 229
229 -
 230
230 -
 231
231 -
 232
232 -
 233
233 -
 234
234 -
 235
235 -
 236
236 -
237
-
238
-
239
-
240
-
241
-
242
-
243
-
244
-
245
-
246
-
247
-
248
-
249
-
250
-
251
-
252
-
253
-
254
-
255
-
256
-
257
-
258
-
259
-
260
 |
 |

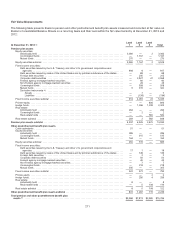
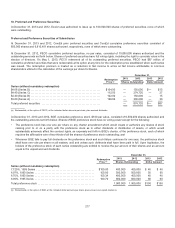
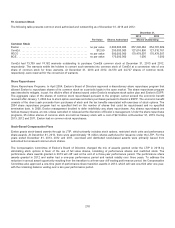
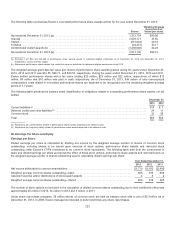
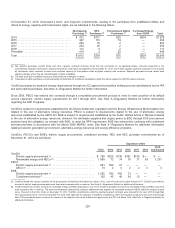
Thefairvalue ofeach option is estimatedon thedate ofgrant usingtheBlack-Scholes-Merton option-pricingmodel.Thefollowing
table presentstheweightedaverageassumptionsusedinthepricingmodel for grantsandtheresultingweightedaveragegrant date
fairvalue ofstock optionsgrantedfor theyearsended2012 and2011:
Year Ended
December 31,
2012 2011
Dividendyield ................................................................................... 5.28% 4.84%
Expectedvolatility................................................................................ 23.20%24.40%
Risk-free interest rate ............................................................................. 1.30%2.65%
Expectedlife(years).............................................................................. 6.256.25
Weightedaveragegrant date fairvalue (per share) .................................................... $ 4.18$6.22
Theassumptionsabove relate to Exelon stock optionsgrantedduringthe periods presentedandtherefore do not includestock
optionsthat were convertedinconnection withthemerger withConstellation duringtheyear ended2012.
Thedividendyieldisbasedon several factors, includingExelon’s mostrecent dividendpayment at thegrant date andtheaverage
stock priceover the previousyear.Expectedvolatilityisbasedon impliedvolatilitiesoftradedstock optionsinExelon’s common
stock and historical volatilityover theestimatedexpectedlifeofthestock options. Therisk-free interest rate for a securitywitha term
equal to theexpectedlifeis basedon a yieldcurveconstructedfrom U.S. Treasurystripsat thetimeofgrant.For each year
presented, theexpectedlife representsthe periodoftimethestock optionsare expectedto be outstandingandisbasedon the
simplifiedmethod. Exelon believesthat thesimplifiedmethodisappropriate due to several factorsthat result inhistorical exercise
data not beingsufficient to determine a reasonable estimate ofexpectedterm. Exelon uses historical data to estimate employee
forfeitures, which are comparedto actual forfeitureson a quarterlybasis andadjustedasnecessary.
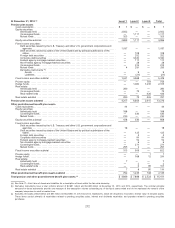
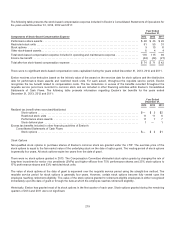
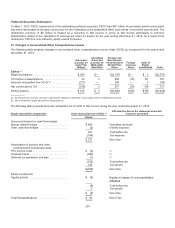
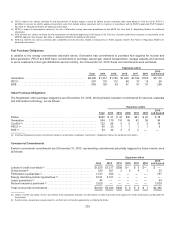
Thefollowingtable presentsinformation withrespecttostock option activityfor theyear endedDecember 31,2013:
Shares
Weighted
Average
Exercise
Price
(per
share)
Weighted
Average
Remaining
Contractual
Life
(years)
Aggregate
Intrinsic
Value
Balanceofsharesoutstandingat December 31,2012 ...................... 21,903,781$45.91
Optionsreinstated.................................................... 751,122 38.60
Optionsexercised .................................................... (670,957) 28.02
Optionsforfeited ..................................................... (54,743)39.36
Optionsexpired...................................................... (893,758) 49.08
Balanceofsharesoutstandingat December 31,2013 ...................... 21,035,445 $46.07 4.72$10
Exercisable at December 31,2013 (a) ................................... 20,188,327 $46.31 4.58 $10
(a)Includesstock options issuedto retirement eligible employees.
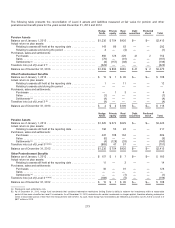
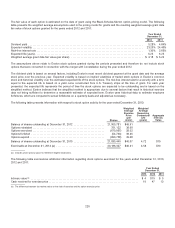
Thefollowingtable summarizesadditional information regardingstock optionsexercisedfor theyearsendedDecember 31,2013,
2012 and2011:
Year Ended
December 31,
2013 2012 2011
Intrinsic value (a).............................................................................. $ 4 $19$5
Cash receivedfor exerciseprice................................................................. 194713
(a)Thedifferencebetween themarket value on thedate ofexerciseandthe option exerciseprice.
220