ComEd 2013 Annual Report Download - page 211
Download and view the complete annual report
Please find page 211 of the 2013 ComEd annual report below. You can navigate through the pages in the report by either clicking on the pages listed below, or by using the keyword search tool below to find specific information within the annual report.-
 1
1 -
2
-
3
-
4
-
5
-
6
-
7
-
8
-
9
-
10
-
11
-
12
-
13
-
14
-
15
-
16
-
17
-
18
-
19
-
20
-
21
-
22
-
23
-
24
-
25
-
26
-
27
-
28
-
29
-
30
-
31
-
32
-
33
-
34
-
35
-
36
-
37
-
38
-
39
-
40
-
41
-
42
-
43
-
44
-
45
-
46
-
47
-
48
-
49
-
50
-
51
-
52
-
53
-
54
-
55
-
56
-
57
-
58
-
59
-
60
-
61
-
62
-
63
-
64
-
65
-
66
-
67
-
68
-
69
-
70
-
71
-
72
-
73
-
74
-
75
-
76
-
77
-
78
-
79
-
80
-
81
-
82
-
83
-
84
-
85
-
86
-
87
-
88
-
89
-
90
-
91
-
92
-
93
-
94
-
95
-
96
-
97
-
98
-
99
-
100
-
101
-
102
-
103
-
104
-
105
-
106
-
107
-
108
-
109
-
110
-
111
-
112
-
113
-
114
-
115
-
116
-
117
-
118
-
119
-
120
-
121
-
122
-
123
-
124
-
125
-
126
-
127
-
128
-
129
-
130
-
131
-
132
-
133
-
134
-
135
-
136
-
137
-
138
-
139
-
140
-
141
-
142
-
143
-
144
-
145
-
146
-
147
-
148
-
149
-
150
-
151
-
152
-
153
-
154
-
155
-
156
-
157
-
158
-
159
-
160
-
161
-
162
-
163
-
164
-
165
-
166
-
167
-
168
-
169
-
170
-
171
-
172
-
173
-
174
-
175
-
176
-
177
-
178
-
179
-
180
-
181
-
182
-
183
-
184
-
185
-
186
-
187
-
188
-
189
-
190
-
191
-
192
-
193
-
194
-
195
-
196
-
197
-
198
-
199
-
200
-
 201
201 -
 202
202 -
 203
203 -
 204
204 -
 205
205 -
 206
206 -
 207
207 -
 208
208 -
 209
209 -
 210
210 -
 211
211 -
 212
212 -
 213
213 -
 214
214 -
 215
215 -
 216
216 -
 217
217 -
 218
218 -
 219
219 -
 220
220 -
 221
221 -
222
-
223
-
224
-
225
-
226
-
227
-
228
-
229
-
230
-
231
-
232
-
233
-
234
-
235
-
236
-
237
-
238
-
239
-
240
-
241
-
242
-
243
-
244
-
245
-
246
-
247
-
248
-
249
-
250
-
251
-
252
-
253
-
254
-
255
-
256
-
257
-
258
-
259
-
260
 |
 |

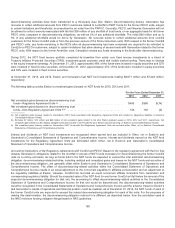
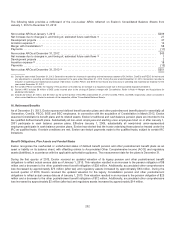
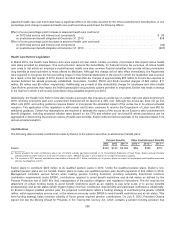
prescription drugbenefit.Management believesthe prescription drugbenefit providedunder Exelon’s postretirement benefit plans
meetstherequirementsfor thesubsidy. InDecember 2011,theCompanydecidedthat beginningin 2013,itwill no longer electto
takethedirectPart Dsubsidy. Beginningin 2013,eligible employeesare offeredan Employee Group Waiver Plan,aMedicare Part
DPlan,withasupplemental “wrap”that closelymatchesthecurrent prescription drugplan design.See theHealth Care Reform
Legislation section belowfor further discussion regardingtheincometaxtreatment ofFederal subsidiesofprescription drugbenefits.
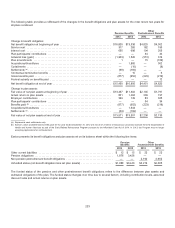
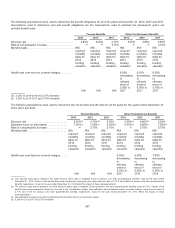
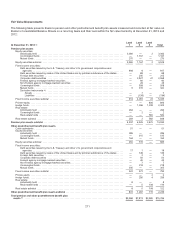
Theeffectofthesubsidy on thecomponentsofnet periodic postretirement benefitcostfor theyearsendedDecember 31,2013,
2012 and2011 includedintheconsolidatedfinancial statementswasasfollows:
2013 2012 2011
Amortization oftheactuarial experienceloss....................................................... $— $(17) $ 3
Reduction incurrent periodservicecost.......................................................... — — 9
Reduction ininterestcostontheAPBO ........................................................... — — 16
Total effectofsubsidy on net periodic postretirement benefitcost...................................... $— $(17) $28
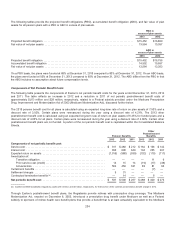
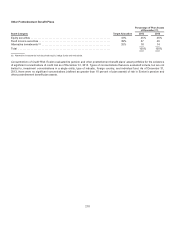
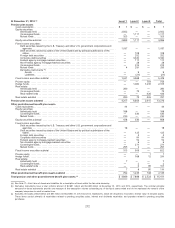
Components of AOCI and Regulatory Assets
Under the authoritativeguidancefor regulatoryaccounting, a portion ofcurrent year actuarial gainsandlossesandprior service
costs(credits) is capitalizedwithinExelon’s ConsolidatedBalanceSheetsto reflecttheexpectedregulatoryrecoveryofthese
amounts, which wouldotherwiseberecordedto AOCI. ThefollowingtablesprovidethecomponentsofAOCI andregulatoryassets
(liabilities) for theyearsendedDecember 31,2013,2012 and2011 for all planscombined.
Pension Benefits
Other
Postretirement
Benefits
2013 2012 2011 2013 2012 2011
Changes in plan assets and benefit obligations recognized in AOCI and
regulatory assets (liabilities):
Current year actuarial (gain)loss........................................ $(1,169) $1,693$ 744 $(628) $ 304$74
Amortization ofactuarial gain(loss)...................................... (562) (450)(331)(83)(81) (66)
Current year prior service(credit)cost................................... — 1—15(109) —
Amortization ofprior service(cost)credit................................. (14) (15) (14) 191738
Current year transition (asset)obligation ................................. — — — — 1—
Amortization oftransition asset (obligation) ............................... — — — — (11) (9)
Curtailments ........................................................ — (10)— — (1)—
Settlements ......................................................... (8) (31)————
Total recognized in AOCI and regulatory assets (liabilities) (a) ............. $(1,753)$1,188 $ 399 $(677) $ 120 $37
(a)Ofthe$1,753million gain relatedto pension benefits, $1,071million and $682million were recognizedinAOCI andregulatoryassets, respectively, during2013.Of
the$677 million gain relatedto other postretirement benefits, $352million and$325million were recognizedinAOCI andregulatoryassets(liabilities), respectively,
during2013.Ofthe$1,188 million loss relatedto pension benefits, $283million and$904million were recognizedinAOCI andregulatoryassets, respectively, during
2012.Ofthe$120 million loss relatedto other postretirement benefits, $39million and$81million were recognizedinAOCI andregulatoryassets, respectively,
during2012.Ofthe$399 million loss relatedto pension benefits, $181million and$218million were recognizedinAOCI andregulatoryassets, respectively, during
2011.Ofthe$37million loss relatedto other postretirement benefits, $13 million and$24million were recognizedinAOCI andregulatoryassets, respectively, during
2011.
205