ComEd 2013 Annual Report Download - page 175
Download and view the complete annual report
Please find page 175 of the 2013 ComEd annual report below. You can navigate through the pages in the report by either clicking on the pages listed below, or by using the keyword search tool below to find specific information within the annual report.-
 1
1 -
2
-
3
-
4
-
5
-
6
-
7
-
8
-
9
-
10
-
11
-
12
-
13
-
14
-
15
-
16
-
17
-
18
-
19
-
20
-
21
-
22
-
23
-
24
-
25
-
26
-
27
-
28
-
29
-
30
-
31
-
32
-
33
-
34
-
35
-
36
-
37
-
38
-
39
-
40
-
41
-
42
-
43
-
44
-
45
-
46
-
47
-
48
-
49
-
50
-
51
-
52
-
53
-
54
-
55
-
56
-
57
-
58
-
59
-
60
-
61
-
62
-
63
-
64
-
65
-
66
-
67
-
68
-
69
-
70
-
71
-
72
-
73
-
74
-
75
-
76
-
77
-
78
-
79
-
80
-
81
-
82
-
83
-
84
-
85
-
86
-
87
-
88
-
89
-
90
-
91
-
92
-
93
-
94
-
95
-
96
-
97
-
98
-
99
-
100
-
101
-
102
-
103
-
104
-
105
-
106
-
107
-
108
-
109
-
110
-
111
-
112
-
113
-
114
-
115
-
116
-
117
-
118
-
119
-
120
-
121
-
122
-
123
-
124
-
125
-
126
-
127
-
128
-
129
-
130
-
131
-
132
-
133
-
134
-
135
-
136
-
137
-
138
-
139
-
140
-
141
-
142
-
143
-
144
-
145
-
146
-
147
-
148
-
149
-
150
-
151
-
152
-
153
-
154
-
155
-
156
-
157
-
158
-
159
-
160
-
161
-
162
-
163
-
164
-
 165
165 -
 166
166 -
 167
167 -
 168
168 -
 169
169 -
 170
170 -
 171
171 -
 172
172 -
 173
173 -
 174
174 -
 175
175 -
 176
176 -
 177
177 -
 178
178 -
 179
179 -
 180
180 -
 181
181 -
 182
182 -
 183
183 -
 184
184 -
 185
185 -
186
-
187
-
188
-
189
-
190
-
191
-
192
-
193
-
194
-
195
-
196
-
197
-
198
-
199
-
200
-
201
-
202
-
203
-
204
-
205
-
206
-
207
-
208
-
209
-
210
-
211
-
212
-
213
-
214
-
215
-
216
-
217
-
218
-
219
-
220
-
221
-
222
-
223
-
224
-
225
-
226
-
227
-
228
-
229
-
230
-
231
-
232
-
233
-
234
-
235
-
236
-
237
-
238
-
239
-
240
-
241
-
242
-
243
-
244
-
245
-
246
-
247
-
248
-
249
-
250
-
251
-
252
-
253
-
254
-
255
-
256
-
257
-
258
-
259
-
260
 |
 |

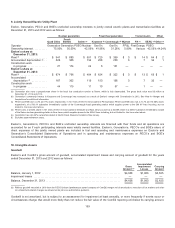
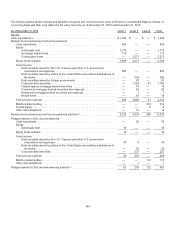
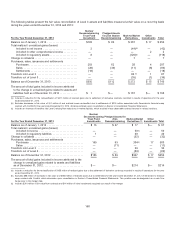
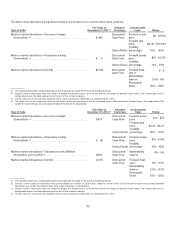
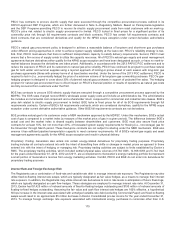
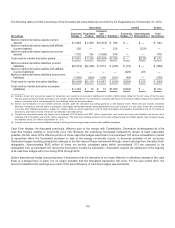
Thefollowingtablespresent theincomestatement classification ofthe total realizedandunrealizedgains(losses) includedin
incomefor Level 3 assetsandliabilitiesmeasuredat fairvalue on a recurringbasis duringtheyearsendedDecember 31,2013 and
2012:
Operating
Revenue
Purchased
Power and
Fuel
Other,
net (a)
Total gains(losses) includedinincomefor theyear endedDecember 31,2013 ................. $(152)$108$2
Changeinthe unrealizedgainsrelatingto assetsandliabilitiesheldfor theyear ended
December 31,2013 ................................................................ $ 40$127$1
Operating
Revenue
Purchased
Power and
Fuel
Other,
net
Total gainsincludedinincomefor theyear endedDecember 31,2012 ........................ $ 54 $ 5 $—
Changeinthe unrealizedgains(losses) relatingto assetsandliabilitiesheldfor theyear ended
December 31,2012 ................................................................ $230 $(16) $—
(a)Other,net activityconsistsofrealizedandunrealizedgains(losses) includedinincomefor theNDT funds heldbyGeneration.
Valuation Techniques Used to Determine Fair Value
Thefollowingdescribesthevaluation techniquesusedto measure thefairvalue oftheassetsandliabilitiesshowninthetables
above.
Cash Equivalents TheRegistrants’ cash equivalentsincludeinvestmentswithmaturitiesofthree months or less when purchased.
Thecash equivalentsshowninthefairvalue tablesare comprisedofinvestmentsinmutual andmoneymarket funds. Thefairvalues
ofthesharesofthesefunds are basedon observable market pricesand, therefore,havebeen categorizedinLevel 1 inthefairvalue
hierarchy.
Nuclear Decommissioning Trust Fund Investments and Pledged Assets for Zion Station Decommissioning The trustfund
investmentshavebeen establishedto satisfy Generation’s nuclear decommissioningobligationsasrequiredbytheNRC. TheNDT
funds holddebtandequitysecuritiesdirectlyandindirectlythrough commingledfunds. Generation’s investment policiesplace
limitationson thetypesandinvestment grade ratings ofthesecuritiesthat maybeheldbythe trusts. These policieslimitthe trust
funds’ exposuresto investmentsinhighlyilliquid marketsandother alternativeinvestments. Investmentswithmaturitiesofthree
months or less when purchased, includingcertainshort-term fixedincomesecuritiesare consideredcash equivalentsandincluded
intherecurringfairvalue measurementshierarchy asLevel 1 or Level 2.
Withrespecttoindividuallyheldequitysecurities, the trusteesobtainpricesfrompricingservices, whosepricesare obtainedfrom
directfeeds frommarket exchanges, which Generation is able to independentlycorroborate.Thefairvaluesofequitysecuritiesheld
directlybythe trustfunds are basedon quotedpricesinactivemarketsandare categorizedinLevel 1.Equitysecuritiesheld
individuallyare primarilytradedon theNewYorkStock ExchangeandNASDAQ-Global SelectMarket, which contain onlyactively
tradedsecuritiesdue to thevolume tradingrequirementsimposedbytheseexchanges.
For fixedincomesecurities, multiple pricesfrompricingservicesare obtainedwhenever possible, which enablescross-provider
validationsinaddition to checks for unusual dailymovements. Aprimarypricesourceis identifiedbasedon asset type,class or
issue for each security. The trusteesmonitor pricessuppliedbypricingservicesandmayuseasupplemental pricesourceorchange
theprimarypricesourceofagiven securityifthe portfoliomanagerschallengeanassignedpriceandthe trusteesdetermine that
another pricesourceis consideredto be preferable.Generation hasobtainedan understandingofhowthesepricesare derived,
includingthe nature andobservabilityoftheinputsusedinderivingsuch prices. Additionally, Generation selectivelycorroboratesthe
fairvaluesofsecuritiesbycomparison to other market-basedpricesources. U.S. Treasurysecuritiesare categorizedasLevel 1
becausetheytradeinahighlyliquid andtransparent market.Thefairvaluesof fixedincomesecurities, excluding U.S. Treasury
securities, are basedon evaluatedpricesthat reflectobservable market information,such asactual tradeinformation or similar
securities, adjustedfor observable differencesandare categorizedinLevel 2.Thefairvaluesofprivate placement fixedincome
securitiesare determinedusingathirdpartyvaluation that containscertainsignificant unobservable inputsandare categorizedin
Level 3.
169