ComEd 2013 Annual Report Download - page 215
Download and view the complete annual report
Please find page 215 of the 2013 ComEd annual report below. You can navigate through the pages in the report by either clicking on the pages listed below, or by using the keyword search tool below to find specific information within the annual report.
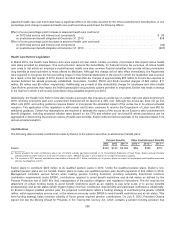
resultsinlower minimumpension contributionsinthe near term while increasingthe premiums pension planspayto thePension
BenefitGuarantyCorporation.Certain provisionsofthelawwere appliedin 2012 while otherswere appliedin 2013.Theestimated
impactsofthelaware reflectedinthe projectedpension contributions.
Unlikethequalifiedpension plans, other postretirement plansare not subjecttostatutoryminimumcontribution requirements.
Exelon’s management has historicallyconsideredseveral factorsindeterminingthelevel ofcontributionsto itsother postretirement
benefit plans, includinglevelsofbenefitclaims paid andregulatoryimplications(amountsdeemedprudent to meet regulatory
expectationsandbestassure continuedrate recovery). In 2014, Exelon anticipatesfundingitsother postretirement benefit plans
basedon thefundingconsiderations discussedabove,withtheexception ofthose plans which remainunfunded. Exelon expectsto
makeother postretirement benefit plan contributions, includingbenefitpaymentsrelatedto unfundedplans, ofapproximately$430
million in 2014.
Estimated Future Benefit Payments
Estimatedfuture benefitpaymentsto participantsin all ofthe pension plansandpostretirement benefit plansat December 31,2013
were:
Pension
Benefits
Other
Postretirement
Benefits
2014.................................................................................... $ 929$204
2015.................................................................................... 851 210
2016.................................................................................... 873219
2017.................................................................................... 902 228
2018.................................................................................... 1,015238
2019through 2023 ........................................................................ 5,257 1,383
Total estimatedfuture benefitpaymentsthrough 2023 ........................................... $9,827$2,482
Plan Assets
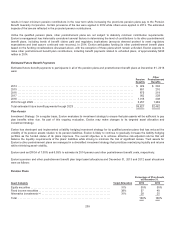
Investment Strategy. Onaregular basis, Exelon evaluatesitsinvestment strategy to ensure that plan assetswill besufficient to pay
plan benefitswhen due.Aspart ofthis ongoingevaluation,Exelon maymakechangesto itstargetedasset allocation and
investment strategy.
Exelon hasdevelopedandimplementedaliabilityhedginginvestment strategy for itsqualifiedpension plansthat hasreducedthe
volatilityofitspension assetsrelativetoitspension liabilities. Exelon is likelyto continue to graduallyincreasetheliabilityhedging
portfolioasthefundedstatusofitsplansimproves. Theoverall objectiveis to achieve attractiverisk-adjustedreturnsthat will
balancetheliquidityrequirementsofthe plans’ liabilities while strivingto minimizetherisk of significant losses. Trustassetsfor
Exelon’s other postretirement plansare managedinadiversifiedinvestment strategy that prioritizesmaximizingliquidityandreturns
while minimizingasset volatility.
Exelon usedan EROAof7.00%and 6.59% to estimate its2014pension andother postretirement benefitcosts, respectively.
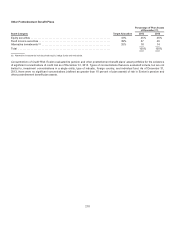
Exelon’s pension andother postretirement benefit plan target asset allocationsandDecember 31,2013 and2012 asset allocations
were asfollows:
Pension Plans
Percentage of Plan Assets
at December 31,
Asset Category Target Allocation 2013 2012
Equitysecurities .......................................................... 31%35% 35%
Fixedincomesecurities .................................................... 38% 3740
Alternativeinvestments(a).................................................. 31%2825
Total ................................................................... 100%100%
209


