ComEd 2013 Annual Report Download - page 80
Download and view the complete annual report
Please find page 80 of the 2013 ComEd annual report below. You can navigate through the pages in the report by either clicking on the pages listed below, or by using the keyword search tool below to find specific information within the annual report.-
 1
1 -
2
-
3
-
4
-
5
-
6
-
7
-
8
-
9
-
10
-
11
-
12
-
13
-
14
-
15
-
16
-
17
-
18
-
19
-
20
-
21
-
22
-
23
-
24
-
25
-
26
-
27
-
28
-
29
-
30
-
31
-
32
-
33
-
34
-
35
-
36
-
37
-
38
-
39
-
40
-
41
-
42
-
43
-
44
-
45
-
46
-
47
-
48
-
49
-
50
-
51
-
52
-
53
-
54
-
55
-
56
-
57
-
58
-
59
-
60
-
61
-
62
-
63
-
64
-
65
-
66
-
67
-
68
-
69
-
 70
70 -
 71
71 -
 72
72 -
 73
73 -
 74
74 -
 75
75 -
 76
76 -
 77
77 -
 78
78 -
 79
79 -
 80
80 -
 81
81 -
 82
82 -
 83
83 -
 84
84 -
 85
85 -
 86
86 -
 87
87 -
 88
88 -
 89
89 -
 90
90 -
91
-
92
-
93
-
94
-
95
-
96
-
97
-
98
-
99
-
100
-
101
-
102
-
103
-
104
-
105
-
106
-
107
-
108
-
109
-
110
-
111
-
112
-
113
-
114
-
115
-
116
-
117
-
118
-
119
-
120
-
121
-
122
-
123
-
124
-
125
-
126
-
127
-
128
-
129
-
130
-
131
-
132
-
133
-
134
-
135
-
136
-
137
-
138
-
139
-
140
-
141
-
142
-
143
-
144
-
145
-
146
-
147
-
148
-
149
-
150
-
151
-
152
-
153
-
154
-
155
-
156
-
157
-
158
-
159
-
160
-
161
-
162
-
163
-
164
-
165
-
166
-
167
-
168
-
169
-
170
-
171
-
172
-
173
-
174
-
175
-
176
-
177
-
178
-
179
-
180
-
181
-
182
-
183
-
184
-
185
-
186
-
187
-
188
-
189
-
190
-
191
-
192
-
193
-
194
-
195
-
196
-
197
-
198
-
199
-
200
-
201
-
202
-
203
-
204
-
205
-
206
-
207
-
208
-
209
-
210
-
211
-
212
-
213
-
214
-
215
-
216
-
217
-
218
-
219
-
220
-
221
-
222
-
223
-
224
-
225
-
226
-
227
-
228
-
229
-
230
-
231
-
232
-
233
-
234
-
235
-
236
-
237
-
238
-
239
-
240
-
241
-
242
-
243
-
244
-
245
-
246
-
247
-
248
-
249
-
250
-
251
-
252
-
253
-
254
-
255
-
256
-
257
-
258
-
259
-
260
 |
 |

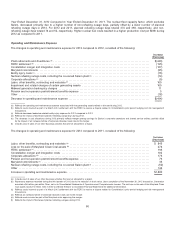
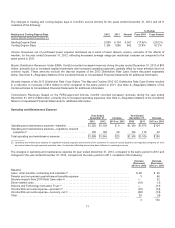
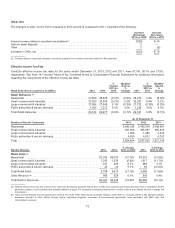
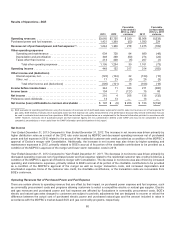
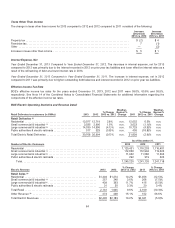
Results of Operations—PECO
2013 2012
Favorable
(unfavorable)
2013 vs. 2012
variance 2011
Favorable
(unfavorable)
2012 vs. 2011
variance
Operating revenues ........................................... $3,100 $3,186 $(86) $3,720 $(534)
Purchasedpower andfuel ....................................... 1,300 1,375 75 1,864 489
Revenues net of purchased power and fuel expense (a) ............ 1,800 1,811 (11)1,856 (45)
Other operating expenses
Operatingandmaintenance.................................. 748 80961794 (15)
Depreciation andamortization ................................ 228217(11)202 (15)
Taxesother than income..................................... 158 162420543
Total other operatingexpenses............................ 1,1341,188 54 1,201 13
Operating income ............................................. 666 623 43655 (32)
Other income and (deductions)
Interestexpense,net ........................................ (115) (123)8(134) 11
Other,net ................................................. 6 8 (2)14 (6)
Total other incomeand(deductions) ....................... (109) (115) 6 (120)5
Income before income taxes .................................... 557 50849 535(27)
Income taxes ................................................. 162127(35) 146 19
Net income ................................................... 395 38114389 (8)
Preferredsecurity dividends ...................................... 7 4 34—
Net income on common stock .................................. $ 388 $ 377 $ 11 $385 $ (8)
(a) PECO evaluatesitsoperatingperformanceusingthemeasuresofrevenuesnet ofpurchasedpower expensefor electric salesandrevenue net offuel expensefor
gassales. PECO believesrevenuesnet ofpurchasedpower expenseandrevenuesnet offuel expense are useful measurementsofitsperformancebecausethey
provideinformation that can beusedto evaluate itsnet revenuesfromoperations. PECO hasincludedthe analysis belowasacomplement to thefinancial
information providedinaccordancewithGAAP. However,revenuesnet ofpurchasedpower expenseandrevenue net offuel expensefiguresare not a presentation
definedunder GAAPandmaynot becomparable to other companies’ presentationsor more useful than theGAAPinformation providedelsewhere inthis report.
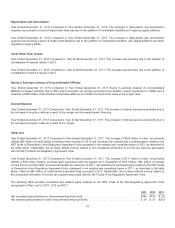
Net Income
Year Ended December 31, 2013 Compared to Year Ended December 31, 2012. Theincreasein net incomewasdriven primarilyby
lower operatingandmaintenanceexpense partiallyoffset by an increaseinincometaxes.
Year Ended December 31, 2012 Compared to Year Ended December 31, 2011. Thedecreasein net incomewasdriven primarilyby
lower operatingrevenuesnet ofpurchasedpower andfuel expenseandincreasedstormcosts. Thedecreaseinrevenuesnet of
purchasedpower andfuel expensewasprimarilyrelatedto unfavorable weather andadecline in electric load. Thedecrease to net
incomewaspartiallyoffset by lower taxesother than income,interestexpenseandincometaxes.
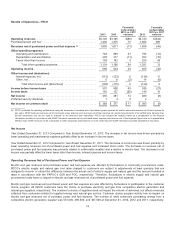
Operating Revenues Net of Purchased Power and Fuel Expense
Electric andgasrevenuesandpurchasedpower andfuel expense are affectedbyfluctuationsincommodityprocurement costs.
PECO’s electric supplyandnatural gascost rateschargedto customersare subjecttoadjustmentsat leastquarterlythat are
designedto recover or refundthedifferencebetween theactual costofelectric supplyandnatural gasandtheamount includedin
ratesinaccordancewiththePAPUC’s GSAand PGC, respectively. Therefore,fluctuationsin electric supplyandnatural gas
procurement costshavenoimpact on electric andgasrevenuesnet ofpurchasedpower andfuel expense.
Electric andgasrevenuesandpurchasedpower andfuel expense are alsoaffectedbyfluctuationsin participation inthecustomer
choice program. All PECO customershavethechoice to purchase electricityandgasfromcompetitive electric generation and
natural gassuppliers, respectively. Thecustomer’s choiceofsuppliersdoesnot impactthevolumeofdeliveries, but affectsrevenues
collectedfromcustomersrelatedto suppliedenergy andnatural gasservice.Customer choice programactivityhasno impacton
electric andgasrevenuesnet ofpurchasepower andfuel expense.Thenumber ofretailcustomerspurchasingenergy froma
competitive electric generation supplier was531,500, 496,500,and387,600 at December 31,2013,2012 and2011,respectively.
74