ComEd 2013 Annual Report Download - page 162
Download and view the complete annual report
Please find page 162 of the 2013 ComEd annual report below. You can navigate through the pages in the report by either clicking on the pages listed below, or by using the keyword search tool below to find specific information within the annual report.-
 1
1 -
2
-
3
-
4
-
5
-
6
-
7
-
8
-
9
-
10
-
11
-
12
-
13
-
14
-
15
-
16
-
17
-
18
-
19
-
20
-
21
-
22
-
23
-
24
-
25
-
26
-
27
-
28
-
29
-
30
-
31
-
32
-
33
-
34
-
35
-
36
-
37
-
38
-
39
-
40
-
41
-
42
-
43
-
44
-
45
-
46
-
47
-
48
-
49
-
50
-
51
-
52
-
53
-
54
-
55
-
56
-
57
-
58
-
59
-
60
-
61
-
62
-
63
-
64
-
65
-
66
-
67
-
68
-
69
-
70
-
71
-
72
-
73
-
74
-
75
-
76
-
77
-
78
-
79
-
80
-
81
-
82
-
83
-
84
-
85
-
86
-
87
-
88
-
89
-
90
-
91
-
92
-
93
-
94
-
95
-
96
-
97
-
98
-
99
-
100
-
101
-
102
-
103
-
104
-
105
-
106
-
107
-
108
-
109
-
110
-
111
-
112
-
113
-
114
-
115
-
116
-
117
-
118
-
119
-
120
-
121
-
122
-
123
-
124
-
125
-
126
-
127
-
128
-
129
-
130
-
131
-
132
-
133
-
134
-
135
-
136
-
137
-
138
-
139
-
140
-
141
-
142
-
143
-
144
-
145
-
146
-
147
-
148
-
149
-
150
-
151
-
 152
152 -
 153
153 -
 154
154 -
 155
155 -
 156
156 -
 157
157 -
 158
158 -
 159
159 -
 160
160 -
 161
161 -
 162
162 -
 163
163 -
 164
164 -
 165
165 -
 166
166 -
 167
167 -
 168
168 -
 169
169 -
 170
170 -
 171
171 -
 172
172 -
173
-
174
-
175
-
176
-
177
-
178
-
179
-
180
-
181
-
182
-
183
-
184
-
185
-
186
-
187
-
188
-
189
-
190
-
191
-
192
-
193
-
194
-
195
-
196
-
197
-
198
-
199
-
200
-
201
-
202
-
203
-
204
-
205
-
206
-
207
-
208
-
209
-
210
-
211
-
212
-
213
-
214
-
215
-
216
-
217
-
218
-
219
-
220
-
221
-
222
-
223
-
224
-
225
-
226
-
227
-
228
-
229
-
230
-
231
-
232
-
233
-
234
-
235
-
236
-
237
-
238
-
239
-
240
-
241
-
242
-
243
-
244
-
245
-
246
-
247
-
248
-
249
-
250
-
251
-
252
-
253
-
254
-
255
-
256
-
257
-
258
-
259
-
260
 |
 |

Accounts Receivable Agreement PECO waspartyto an agreement withafinancial institution under which it transferredan
undividedinterest,adjusteddaily, initsaccountsreceivable designatedunder theagreement inexchangefor proceeds of$210
million, which wasclassifiedasashort-termnote payable on Exelon’s and PECO’s ConsolidatedBalanceSheetsasof
December 31,2012.Theagreement terminatedon August30,2013 and PECO paid downthe outstandingprincipal of$210 million.
Thefinancial institution no longer hasan undividedinterestintheaccountsreceivable designatedunder theagreement.Asof
December 31,2012,thefinancial institution’s undividedinterestinExelon’s and PECO’s gross accountsreceivable wasequivalent
to $289 million, which representedthefinancial institution’s interestinPECO’s eligible receivablesascalculatedunder the terms of
theagreement.Theagreement required PECO to maintaineligible receivablesat leastequivalent to thefinancial institution’s
undividedinterest.
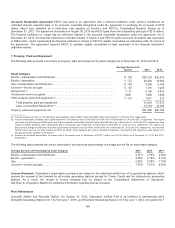
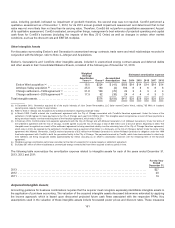
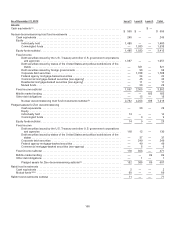
7. Property, Plant and Equipment
Thefollowingtable presentsasummaryofproperty, plant andequipment by asset categoryasofDecember 31,2013 and2012:
Average Service Life
(years) 2013 2012
Asset Category
Electric—transmission and distribution .......................................... 5-90$28,123 $26,576
Electric—generation ......................................................... 1-5220,420 19,004
Gas—transportation and distribution ............................................ 5-903,296 3,108
Common—electric andgas ................................................... 5-501,101 1,029
Nuclear fuel (a).............................................................. 1-8 5,196 4,815
Construction workin progress ................................................. N/A1,8901,926
Other property, plant andequipment (b) .......................................... 1-511,017912
Total property, plant andequipment ........................................ 61,04357,370
Less: accumulateddepreciation (c) .......................................... 13,713 12,184
Property, plant andequipment,net ............................................. $47,330 $45,186
(a)Includesnuclear fuel that is inthefabrication andinstallation phaseof $947 million and $894 million at December 31,2013 and2012,respectively.
(b) IncludesGeneration’s buildings under capital leasewitha net carryingvalue of$23 million and$20 million at December 31,2013 and2012,respectively. Theoriginal
costbasis ofthebuildings was $59 million andtotal accumulatedamortization was$36million and$33 million asofDecember 31,2013 and2012,respectively. Also
includesComEd’s buildings under capital leasewitha net carryingvalue of$8million and$0million at December 31,2013 and2012,respectively. Theoriginal cost
basis ofthebuildings was$8million andtotal accumulatedamortization was$0million and$0million asofDecember 31,2013 and2012,respectively. Includesland
heldfor future useandnon utilitypropertyat PECO and BGE. Thesebalancesalsoincludecapitalizedacquisition,development andexploration costsrelatedto oil
andgasproduction activitiesat Generation.
(c) Includesaccumulatedamortization ofnuclear fuel inthe reactor core at Generation of$2,371million and$2,078 million asofDecember 31,2013 and2012,
respectively.
Thefollowingtable presentsthe annual depreciation provisionsasa percentageofaverageservicelifefor each asset category.
Average Service Life Percentage by Asset Category 2013 2012 2011
Electric—transmission and distribution ....................................................... 2.91%2.76% 2.59%
Electric—generation ...................................................................... 3.35% 3.15% 3.12%
Gas .................................................................................... 2.06% 2.03%1.73%
Common—electric andgas................................................................. 7.53% 7.61%8.05%
License Renewals. Generation’s depreciation provisionsare basedon theestimateduseful livesofitsgeneratingstations, which
assumethe renewal ofthelicensesfor all nuclear generatingstations(except for Oyster Creek) andthehydroelectric generating
stations. Asaresult,thereceipt oflicense renewalshasno impactontheConsolidatedStatementsofOperations.
See Note 3—RegulatoryMattersfor additional information regardinglicense renewals.
Plant Retirements
Schuylkill Station and Riverside Station.OnOctober 31,2012,Generation notified PJM ofitsintention to permanentlyretire
Schuylkill GeneratingStation Unit1by February1,2013,andRiversideGeneratingStation Unit6byJune 1,2014. Schuylkill Unit1
156