ComEd 2013 Annual Report Download - page 257
Download and view the complete annual report
Please find page 257 of the 2013 ComEd annual report below. You can navigate through the pages in the report by either clicking on the pages listed below, or by using the keyword search tool below to find specific information within the annual report.-
 1
1 -
2
-
3
-
4
-
5
-
6
-
7
-
8
-
9
-
10
-
11
-
12
-
13
-
14
-
15
-
16
-
17
-
18
-
19
-
20
-
21
-
22
-
23
-
24
-
25
-
26
-
27
-
28
-
29
-
30
-
31
-
32
-
33
-
34
-
35
-
36
-
37
-
38
-
39
-
40
-
41
-
42
-
43
-
44
-
45
-
46
-
47
-
48
-
49
-
50
-
51
-
52
-
53
-
54
-
55
-
56
-
57
-
58
-
59
-
60
-
61
-
62
-
63
-
64
-
65
-
66
-
67
-
68
-
69
-
70
-
71
-
72
-
73
-
74
-
75
-
76
-
77
-
78
-
79
-
80
-
81
-
82
-
83
-
84
-
85
-
86
-
87
-
88
-
89
-
90
-
91
-
92
-
93
-
94
-
95
-
96
-
97
-
98
-
99
-
100
-
101
-
102
-
103
-
104
-
105
-
106
-
107
-
108
-
109
-
110
-
111
-
112
-
113
-
114
-
115
-
116
-
117
-
118
-
119
-
120
-
121
-
122
-
123
-
124
-
125
-
126
-
127
-
128
-
129
-
130
-
131
-
132
-
133
-
134
-
135
-
136
-
137
-
138
-
139
-
140
-
141
-
142
-
143
-
144
-
145
-
146
-
147
-
148
-
149
-
150
-
151
-
152
-
153
-
154
-
155
-
156
-
157
-
158
-
159
-
160
-
161
-
162
-
163
-
164
-
165
-
166
-
167
-
168
-
169
-
170
-
171
-
172
-
173
-
174
-
175
-
176
-
177
-
178
-
179
-
180
-
181
-
182
-
183
-
184
-
185
-
186
-
187
-
188
-
189
-
190
-
191
-
192
-
193
-
194
-
195
-
196
-
197
-
198
-
199
-
200
-
201
-
202
-
203
-
204
-
205
-
206
-
207
-
208
-
209
-
210
-
211
-
212
-
213
-
214
-
215
-
216
-
217
-
218
-
219
-
220
-
221
-
222
-
223
-
224
-
225
-
226
-
227
-
228
-
229
-
230
-
231
-
232
-
233
-
234
-
235
-
236
-
237
-
238
-
239
-
240
-
241
-
242
-
243
-
244
-
245
-
246
-
 247
247 -
 248
248 -
 249
249 -
 250
250 -
 251
251 -
 252
252 -
 253
253 -
 254
254 -
 255
255 -
 256
256 -
 257
257 -
 258
258 -
 259
259 -
 260
260
 |
 |

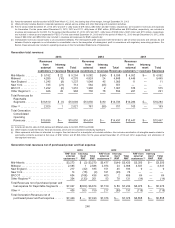
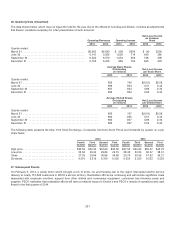
26. Quarterly Data (Unaudited)
Thedata shownbelow, which maynot equal the total for theyear due to theeffectsofroundinganddilution,includesall adjustments
that Exelon considersnecessaryfor a fair presentation ofsuch amounts:
Operating Revenues Operating Income
Net (Loss) Income
on Common
Stock
2013 2012 2013 2012 2013 2012
Quarter ended:
March 31 ............................................. $6,082$4,690$508$359 $ (4) $200
June 30 .............................................. 6,1415,966 1,005714490286
September 30 ......................................... 6,502 6,579 1,254 603 738296
December 31 ......................................... 6,1636,254 889 704 495 378
Average Basic Shares
Outstanding
(in millions)
Net (Loss) Income
per Basic Share
2013 2012 2013 2012
Quarter ended:
March 31 ....................................................... 855 705$(0.01)$0.28
June 30 ........................................................ 856 8530.57 0.34
September 30 ................................................... 857 854 0.86 0.35
December 31 .................................................... 856 854 0.600.44
Average Diluted Shares
Outstanding
(in millions)
Net (Loss) Income
per Diluted Share
2013 2012 2013 2012
Quarter ended:
March 31 ....................................................... 855 707$(0.01)$0.28
June 30 ........................................................ 860856 0.57 0.33
September 30 ................................................... 860857 0.86 0.35
December 31 .................................................... 860857 0.59 0.44
Thefollowingtable presentstheNewYorkStock Exchange—Composite Common Stock Pricesand dividends by quarter on a per
share basis:
2013 2012
Fourth Third Second First Fourth Third Second First
Quarter Quarter Quarter Quarter Quarter Quarter Quarter Quarter
High price..................................... $30.59 $32.42$37.80$34.56 $37.50$39.82$39.37$43.70
Lowprice..................................... 26.64 29.4229.84 29.10 28.4034.54 36.2738.31
Close........................................ 27.3929.64 30.88 34.48 29.74 35.58 37.6239.21
Dividends ..................................... 0.310 0.310 0.310 0.5250.5250.5250.5250.525
27. Subsequent Events
OnFebruary5,2014, awinter storm which broughtamix ofsnow, iceandfreezingraintotheregion interruptedelectric service
deliveryto nearly715,000 customersinPECO’s service territory. Restoration effortsare continuingandwill includesignificant costs
associatedwithemployee overtime,support fromother utilitiesandincremental equipment,contractedtree trimmingcrews and
supplies. PECO estimatesthat restoration effortswill haveamaterial impacttoExelon’s and PECO’s resultsofoperationsandcash
flows for thefirstquarter of2014.
251