ComEd 2013 Annual Report Download - page 174
Download and view the complete annual report
Please find page 174 of the 2013 ComEd annual report below. You can navigate through the pages in the report by either clicking on the pages listed below, or by using the keyword search tool below to find specific information within the annual report.-
 1
1 -
2
-
3
-
4
-
5
-
6
-
7
-
8
-
9
-
10
-
11
-
12
-
13
-
14
-
15
-
16
-
17
-
18
-
19
-
20
-
21
-
22
-
23
-
24
-
25
-
26
-
27
-
28
-
29
-
30
-
31
-
32
-
33
-
34
-
35
-
36
-
37
-
38
-
39
-
40
-
41
-
42
-
43
-
44
-
45
-
46
-
47
-
48
-
49
-
50
-
51
-
52
-
53
-
54
-
55
-
56
-
57
-
58
-
59
-
60
-
61
-
62
-
63
-
64
-
65
-
66
-
67
-
68
-
69
-
70
-
71
-
72
-
73
-
74
-
75
-
76
-
77
-
78
-
79
-
80
-
81
-
82
-
83
-
84
-
85
-
86
-
87
-
88
-
89
-
90
-
91
-
92
-
93
-
94
-
95
-
96
-
97
-
98
-
99
-
100
-
101
-
102
-
103
-
104
-
105
-
106
-
107
-
108
-
109
-
110
-
111
-
112
-
113
-
114
-
115
-
116
-
117
-
118
-
119
-
120
-
121
-
122
-
123
-
124
-
125
-
126
-
127
-
128
-
129
-
130
-
131
-
132
-
133
-
134
-
135
-
136
-
137
-
138
-
139
-
140
-
141
-
142
-
143
-
144
-
145
-
146
-
147
-
148
-
149
-
150
-
151
-
152
-
153
-
154
-
155
-
156
-
157
-
158
-
159
-
160
-
161
-
162
-
163
-
 164
164 -
 165
165 -
 166
166 -
 167
167 -
 168
168 -
 169
169 -
 170
170 -
 171
171 -
 172
172 -
 173
173 -
 174
174 -
 175
175 -
 176
176 -
 177
177 -
 178
178 -
 179
179 -
 180
180 -
 181
181 -
 182
182 -
 183
183 -
 184
184 -
185
-
186
-
187
-
188
-
189
-
190
-
191
-
192
-
193
-
194
-
195
-
196
-
197
-
198
-
199
-
200
-
201
-
202
-
203
-
204
-
205
-
206
-
207
-
208
-
209
-
210
-
211
-
212
-
213
-
214
-
215
-
216
-
217
-
218
-
219
-
220
-
221
-
222
-
223
-
224
-
225
-
226
-
227
-
228
-
229
-
230
-
231
-
232
-
233
-
234
-
235
-
236
-
237
-
238
-
239
-
240
-
241
-
242
-
243
-
244
-
245
-
246
-
247
-
248
-
249
-
250
-
251
-
252
-
253
-
254
-
255
-
256
-
257
-
258
-
259
-
260
 |
 |

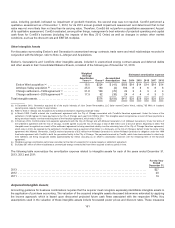
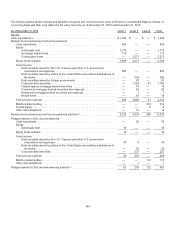
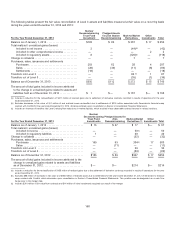
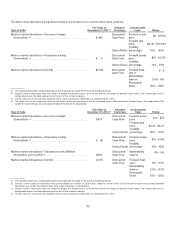
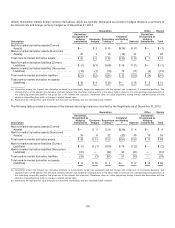
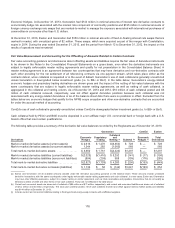
Thefollowingtablespresent thefairvalue reconciliation ofLevel 3 assetsandliabilitiesmeasuredat fairvalue on a recurringbasis
duringtheyearsendedDecember 31,2013 and2012:
For the Year Ended December 31, 2013
Nuclear
Decommissioning
Trust Fund
Investment
Pledged Assets
for Zion Station
Decommissioning
Mark-to-Market
Derivatives
Other
Investments Total
BalanceasofJanuary1,2013 ...................... $183$89 $367 $ 17 $ 656
Total realized/unrealizedgains(losses)
Includedin net income......................... 2— (44)(a)—(42)
Includedinother comprehensiveincome.......... — — — 22
Includedinregulatoryassets.................... 8 — (126)(b) —(118)
Changeincollateral ............................... — — 7 — 7
Purchases, sales, issuancesandsettlements
Purchases ................................... 203 62284297
Sales ....................................... (28) (39) (11) (8) (86)
Settlements .................................. (18) — — — (18)
Transfersinto Level 3 ............................. — — 86(c) 187
Transfersout ofLevel 3 ............................ — — (35) (1)(36)
BalanceasofDecember 31,2013 ................... $350$112 $272$15 $ 749
Theamount oftotal gainsincludedinincome attributed
to thechangein unrealizedgainsrelatedto assetsand
liabilitiesheldasofDecember 31,2013 ............. $ 1$— $ 167 $— $ 168
(a)Includesareduction for thereclassification of$211 million ofrealizedgainsdue to settlement ofderivativecontractsrecordedinresultsofoperationsfor theyear
endedDecember 31,2013.
(b) Excludesdecreasesinfairvalue of$11 million ofandrealizedlossesreclassifieddue to settlementsof$215million associatedwithGeneration’s financial swap
contractwithComEd for theyear endedDecember 31,2013.All items eliminate upon consolidation inExelon’s ConsolidatedFinancial Statements.
(c) Includesan increaseoftransfersinto Level 3 arisingfromreductionsinmarket liquidity, which resultedinless observable contract tenuresinvariouslocations.
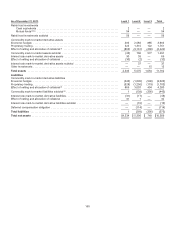
For the Year Ended December 31, 2012
Nuclear
Decommissioning
Trust Fund
Investments
Pledged Assets for
Zion
Decommissioning
Mark-to-Market
Derivatives (b)
Other
Investments Total
BalanceasofJanuary1,2012 .......................... $ 13 $37$17$—$67
Total realized/unrealizedgains(losses)
Includedinincome................................ — — 59
(a)—59
Includedinregulatoryliabilities ...................... 1—39—40
Changeincollateral ................................... — — (32)—(32)
Purchases, sales, issuancesandsettlements
Purchases ....................................... 169 63334(c) 17583
Sales ........................................... — (11)——(11)
Transfersinto Level 3 ................................. — — 39—39
Transfersout ofLevel 3 ................................ — — (89) — (89)
BalanceasofDecember 31,2012 ....................... $183$89 $367 $ 17 $656
Theamount oftotal gainsincludedinincome attributedto the
changein unrealizedgainsrelatedto assetsandliabilities
asofDecember 31,2012 ............................. $— $— $214$—$214
(a)Includesareduction for thereclassification of$155 million ofrealizedgainsdue to thesettlement ofderivativecontractsrecordedinresultsofoperationsfor theyear
endedDecember 31,2012.
(b) Excludes $98 million ofincreasesinfairvalue and $566 million ofrealizedlossesdue to settlementsfor theyear endedDecember 31,2012 ofGeneration’s financial
swap contractwithComEd, which eliminatesupon consolidation inExelon’s ConsolidatedFinancial Statements. This position wasde-designatedasacash flow
hedgeprior to themerger date.
(c) Includes$310 million offairvalue fromcontractsand$14million ofother investmentsacquiredasaresult ofthemerger.
168