ComEd 2013 Annual Report Download - page 72
Download and view the complete annual report
Please find page 72 of the 2013 ComEd annual report below. You can navigate through the pages in the report by either clicking on the pages listed below, or by using the keyword search tool below to find specific information within the annual report.-
 1
1 -
2
-
3
-
4
-
5
-
6
-
7
-
8
-
9
-
10
-
11
-
12
-
13
-
14
-
15
-
16
-
17
-
18
-
19
-
20
-
21
-
22
-
23
-
24
-
25
-
26
-
27
-
28
-
29
-
30
-
31
-
32
-
33
-
34
-
35
-
36
-
37
-
38
-
39
-
40
-
41
-
42
-
43
-
44
-
45
-
46
-
47
-
48
-
49
-
50
-
51
-
52
-
53
-
54
-
55
-
56
-
57
-
58
-
59
-
60
-
61
-
 62
62 -
 63
63 -
 64
64 -
 65
65 -
 66
66 -
 67
67 -
 68
68 -
 69
69 -
 70
70 -
 71
71 -
 72
72 -
 73
73 -
 74
74 -
 75
75 -
 76
76 -
 77
77 -
 78
78 -
 79
79 -
 80
80 -
 81
81 -
 82
82 -
83
-
84
-
85
-
86
-
87
-
88
-
89
-
90
-
91
-
92
-
93
-
94
-
95
-
96
-
97
-
98
-
99
-
100
-
101
-
102
-
103
-
104
-
105
-
106
-
107
-
108
-
109
-
110
-
111
-
112
-
113
-
114
-
115
-
116
-
117
-
118
-
119
-
120
-
121
-
122
-
123
-
124
-
125
-
126
-
127
-
128
-
129
-
130
-
131
-
132
-
133
-
134
-
135
-
136
-
137
-
138
-
139
-
140
-
141
-
142
-
143
-
144
-
145
-
146
-
147
-
148
-
149
-
150
-
151
-
152
-
153
-
154
-
155
-
156
-
157
-
158
-
159
-
160
-
161
-
162
-
163
-
164
-
165
-
166
-
167
-
168
-
169
-
170
-
171
-
172
-
173
-
174
-
175
-
176
-
177
-
178
-
179
-
180
-
181
-
182
-
183
-
184
-
185
-
186
-
187
-
188
-
189
-
190
-
191
-
192
-
193
-
194
-
195
-
196
-
197
-
198
-
199
-
200
-
201
-
202
-
203
-
204
-
205
-
206
-
207
-
208
-
209
-
210
-
211
-
212
-
213
-
214
-
215
-
216
-
217
-
218
-
219
-
220
-
221
-
222
-
223
-
224
-
225
-
226
-
227
-
228
-
229
-
230
-
231
-
232
-
233
-
234
-
235
-
236
-
237
-
238
-
239
-
240
-
241
-
242
-
243
-
244
-
245
-
246
-
247
-
248
-
249
-
250
-
251
-
252
-
253
-
254
-
255
-
256
-
257
-
258
-
259
-
260
 |
 |

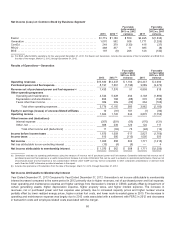
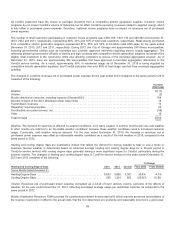
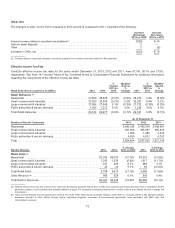
Year Ended December 31, 2012 Compared to Year Ended December 31, 2011.Thenuclear fleet capacityfactor, which excludes
Salem, decreasedprimarilydue to a higher number ofnon-refuelingoutagedays, partiallyoffset by alower number ofplanned
refuelingoutagedays in 2012.For 2012 and2011,plannedrefuelingoutagedays totaled274 and283,respectively, andnon-
refuelingoutagedays totaled73and52,respectively. Higher nuclear fuel costsresultedinahigher production cost per MWh during
2012 ascomparedto 2011.
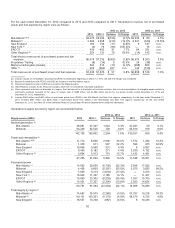
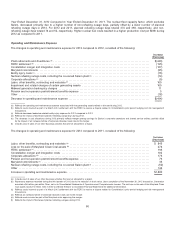
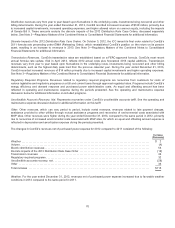
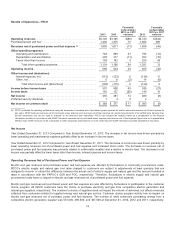
Operating and Maintenance Expense
Thechangesin operatingandmaintenanceexpensefor 2013 comparedto 2012,consistedofthefollowing:
Increase
(Decrease)
Plant retirementsand divestitures(a)...................................................................... $(440)
FERCsettlement (b) ................................................................................... (195)
Constellation merger andintegration costs ................................................................ (107)
Marylandcommitments ................................................................................ (35)
Bodilyinjurycosts(c) ................................................................................... (16)
Nuclear refuelingoutagecosts, includingtheco-ownedSalemplant (d) ......................................... (14)
Corporate allocations(e)................................................................................ (5)
Labor,other benefits, contractingandmaterials(f) ........................................................... 160
Impairment andrelatedchargesofcertaingeneratingassets ................................................. 160
Midwestgeneration bankruptcy charges .................................................................. 11
Pension andnon-pension postretirement benefitsexpense................................................... 5
Other ............................................................................................... (18)
Decreasein operatingandmaintenanceexpense........................................................... $(494)
(a)Reflectsthe operatingandmaintenanceexpenseassociatedwiththegeneratingassetsretiredor divestedduring2012.
(b) Reflectscostsincurredaspart ofaMarch 2012 settlement withtheFERCto resolveadispute relatedto Constellation’s prior periodhedgingandrisk management
transactions.
(c) Reflectsdecreasedasbestos-relatedbodilyinjuryexpensefor 2013 comparedto 2012.
(d) Reflectstheimpactofdecreasedplannedrefuelingoutagedays during2013.
(e)Thedecreaseincost allocationsduring2013 primarilyreflectsmerger synergy savings for Exelon’s corporate operationsandsharedservice entities, partiallyoffset
by theimpactofan increasedshare ofcorporate allocatedcostsdue to themerger.
(f) Includescostofsalesofour other business activitiesthat are not allocatedto a region.
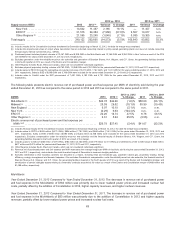
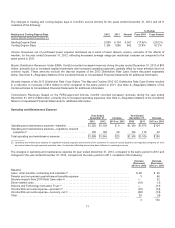
Thechangesin operatingandmaintenanceexpensefor 2012 comparedto 2011,consistedofthefollowing:
Increase
(Decrease)
Labor,other benefits, contractingandmaterials(a).......................................................... $ 845
Loss on thesale ofMarylandClean Coal assets(b) .......................................................... 278
FERCsettlement (c) .................................................................................... 195
Constellation merger andintegration costs ................................................................ 182
Corporate allocations(d) ................................................................................ 175
Pension andnon-pension postretirement benefitsexpense................................................... 76
Marylandcommitments(e).............................................................................. 35
Nuclear refuelingoutagecosts, includingtheco-ownedSalemplant (f) .......................................... (52)
Other ............................................................................................... 146
Increasein operatingandmaintenanceexpense............................................................ $1,880
(a)Includescostofsalesofour other business activitiesthat are not allocatedto a region.
(b) Representsexpenserecordedduringthethirdquarter of2012 due to thereduction inbookvalue.Upon completion oftheNovember 30,2012 transaction,Generation
recordeda$6 million gainwithinOther,net initsConsolidatedStatementsofOperationsandComprehensiveIncome.The net loss on thesale oftheMarylandClean
Coal assetswas$272million.See 4oftheCombinedNotesto ConsolidatedFinancial Statementsfor additional information.
(c) Reflectscostsincurredaspart ofaMarch 2012 settlement withtheFERCto resolveadispute relatedto Constellation’s prior periodhedgingandrisk management
transactions.
(d) Reflectsan increasedshare ofcorporate allocatedcostsdue to themerger.
(e)Reflectscostsincurredaspart oftheMarylandorder approvingthemerger.
(f) Reflectstheimpactofdecreasedplannedrefuelingoutagesduring2012.
66